

To deliver a seamless user experience across different browsers and devices is crucial for any business. By simulating real user interactions, they can identify potential issues before their software products are launched. With the Playwright tool, you can automate and speed up the testing process. You can prevent bugs, by detecting unexpected behavior.
However, even with great automated tests in place, some issues might still arise. This is where debugging and tracing features become essential in your Playwright testing toolkit.
Debugging & Tracing in Playwright: What Exactly Are They?
→ Debugging. It is the process of identifying and fixing issues within your code that includes examining how your code behaves, pinpointing errors that cause unexpected results, and making necessary changes to make sure that it functions correctly.
→ Tracing. In the context of Playwright, tracing refers to recording a detailed log of your test’s execution. This log captures information like user actions (clicks, navigation), screenshots of the page at specific points, and any console messages generated during the test run. This record is particularly useful for debugging, especially when dealing with headless tests on CI platforms.
With the debugging Playwright feature, you can walk through your test code slowly and use developer tools to find the exact spot where the error occurs. Additionally, tracing allows you to record a detailed log of every action your test performs, including screenshots and console logs. Only by effectively utilizing debugging and tracing can you transform your Playwright e2e tests from fragile scripts to robust and reliable tools. Let’s discover why debugging and tracing foster the creation of well-structured and maintainable Playwright tests in detail:
The Importance of Debugging & Tracing in Playwright
Debugging and tracing in Playwright can help you troubleshoot and keep your tests on track. Let’s discover why teams should pay attention at them:
- Developers can identify the exact cause of test failures that contributes to faster fixes.
- Developers can check the execution flow of their tests step-by-step to quickly identify the exact point where an error occurs.
- Developers can make sure that tests accurately reflect the expected behavior of the software product to drive better test outcomes. With a clear picture of how tests are executed, developers can identify potential bottlenecks and optimize tests for better efficiency.
- Developers understand how long each step in a test takes to detect areas that slow down tests and work on optimizations.
- Developers can get valuable information about test execution to simplify track progress and identify areas where further improvements should be made.
Debugging Process: Key Steps
By integrating with browser’s developer tools features, commonly known as DevTools, this combination allows teams to utilize functionalities like inspecting elements, running developer tools console commands, and monitoring logs to improve the Playwright test debugging process, including the following:
- Identifying the issue by recognizing a problem in your code (errors, unexpected behavior during testing, or not desired program output).
- Reproducing the issue to detect and isolate the root cause to fix the correct issue.
- Collecting as much information as possible about the issue.
- Examining the code by carefully analyzing the code around the suspected area and looking for potential errors in logic, syntax mistakes, or incorrect assumptions about data types or behavior.
- Testing potential solutions and developing hypotheses about what might be causing the problem.
- Verifying and thoroughly testing your code again.
How to run & debug Playwright Tests: Essential Techniques
Playwright gives you several ways to find out why a test fails. Here’s the quick answer, then the details.
How to debug Playwright tests
To debug Playwright tests, run npx playwright test --debug. This opens the Playwright Inspector, where you can pause execution and step through each action.
Playwright scripts work with the Playwright debugger and existing tools, like Node.js debuggers and Browser Developer tools, and help you understand why a test might fail.
For starting, here are some useful commands:
npx playwright test --ui //Run tests in UI mode
npx playwright test --headed //Run tests in headed mode

npx playwright test tests/todo-page.spec.ts  // Run a single test file
npx playwright test -g "add a todo item" //Run the test with the title
npx playwright test my-spec.ts:42 //Run tests that are in line 42 in my-spec.ts
npx playwright test tests/todo-page/ tests/landing-page/ // Run a set of test files
In addition, pay attention on Playwright Annotations to aid in debugging. Let’s briefly start with the main ones ⬇️
Focusing on some tests, only these tests run
test.only('focus this test', async ({ page }) => {
  // Run only focused tests in the entire project.
});
Mark a test as skipped
test.skip('skip this test', async ({ page }) => {
  // This test is not run
});
Mark the test as failing
test.fail('marks the test as failing', async ({ page }) => {
  // If the test does not fail, Playwright will complain
});
Option opposite to the failed annotation
test.fixme('marks the test as failing', async ({ page }) => {
  // Use when you will run the slow or crashed tests
});
Reminding, you can explore all types of annotations, tags, grouping and assigning methods in the Playwright documentation.
Also, you can use Soft Assertions. By default, failed assertion will terminate test execution, but failed soft assertions do not terminate test execution, but mark the test as failed. Note that soft assertions only work with Playwright test runner.
// Make a few checks that will not stop the test when failed...
await expect.soft(page.getByTestId('status')).toHaveText('Success');

// Avoid running further if there were soft assertion failures.
expect(test.info().errors).toHaveLength(0);
Going further into our question… As you can see Playwright tool is quite rich. Now let’s overview Playwright Debug techniques that will help you detect issues, fix them and improve test reliability 😀:
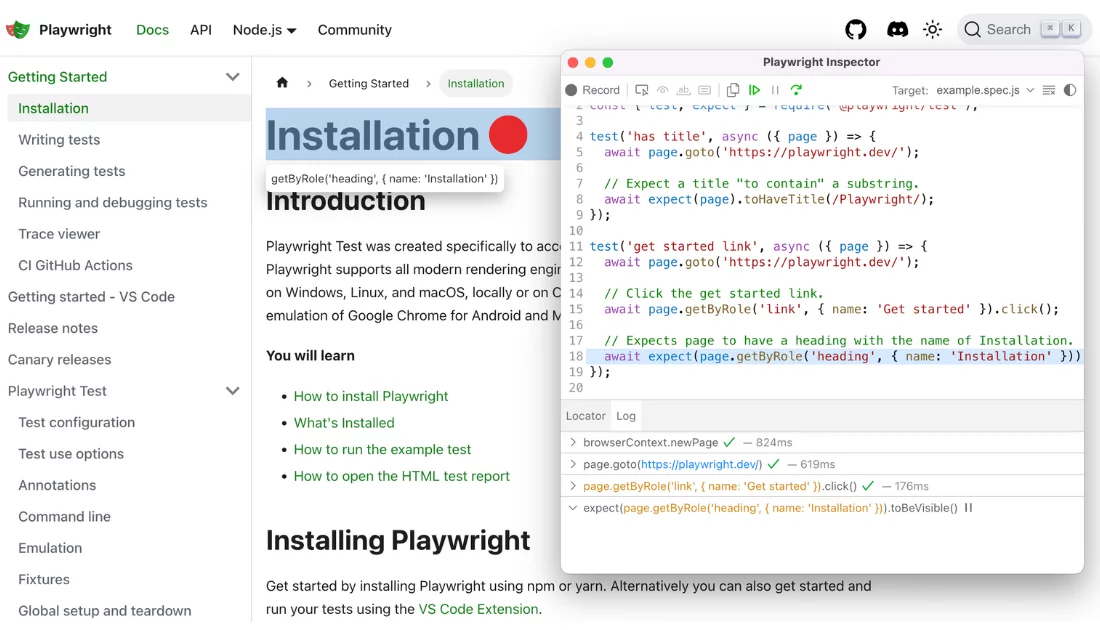
#1: Playwright Inspector
The Playwright Inspector is known as a GUI tool that comes with the framework by default, and no additional configuration is required to use this tool. With its robust capabilities, teams can investigate thoroughly the test execution to get a detailed overview of test behavior and state at each step. This helps them not only identify and fix issues but also increase their test suite effectiveness.
How to open Playwright Inspector
To open the Playwright Inspector, run npx playwright test --debug. The Inspector window opens automatically and pauses the test on the first step.
There are three ways to launch it:
- Using
--debug - Using
PWDEBUG await page.pause()
The first example of commands for debugging
npx playwright test --debug //Launch debugging for all tests.
npx playwright test sample --debug //Debugging on tests.
The second alternative command launch Playwright inspector
Remember that PWDEBUG enables Playwright debug mode and opens the inspector. Let’s set the PWDEBUG=1 environment variable to run your tests:
PWDEBUG=1 npm run testOnce you enter the command, the UI window also known as the Playwright Inspector window opens and shows the line is being executed. You can debug the test line by line using this window.
When using PWDEBUG=1 flag, you need to remember the following:
- Browser launches in headed mode Playwright to see the browser window during test execution for visual debugging.
- Timeouts might be disabled to prevent interruptions while debugging.
- The Playwright Inspector is split into two following sections. First, display your test code for setting breakpoints and stepping through execution. Second to show real-time information about test execution/browser interactions.
- Use
await page.pause()in your Playwright script to pause the test. - Set
PWDEBUG=0to disable the automatic Playwright Inspector launch.
As you can see the Playwright Inspector comes with all the built-in things that provide you with a debugging session. It allows you to visually inspect your tests as they run, namely:
- Set Breakpoints: Click on the line numbers to set breakpoints where you want the execution to pause.
- Control Execution: Use the play, pause, step over, step into, and step out buttons to control the flow of your test.
- Inspect Elements: Hover over elements to see their details and ensure your selectors are accurate.
Thus, you can go step by step by debugging what is going on with the native debug UI, as Playwright signals to you what elements it is interacting with. BTW, Playwright supports Live editing locators
Moreover, Playwright Inspector is powered by a feature called Codegen that simplifies the process of creating test scripts. Acting as a recording tool, it captures your interactions with a web page and generates the Playwright code.
How to record scripts using Playwright Inspector Tool
With the Playwright Inspector tool, you can start initiating generating code script. The result will be the same as you use the following, command:
npx playwright codegen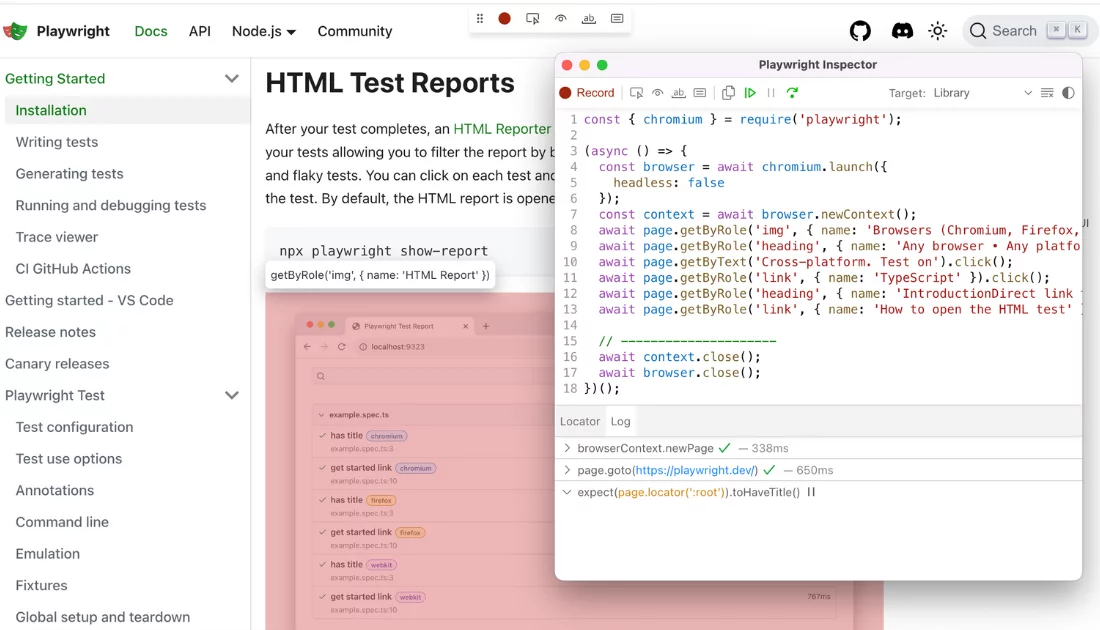
- Click the Record button to start or to stop.
- As the browser opens
baseURL, you can navigate through the web page and perform the actions you want to test. - Once you get the recorded script, copy it and you can simply close the Playwright Inspector window.
#2: Browser Developer Tools Integration
Playwright tool integrates with your browser developer tools, commonly known as DevTools. This powerful combination allows the team to apply DevTools functionalities to improve the debugging process within the Playwright tests. To access DevTools, you need to:
→ Right-click anywhere on the browser window during a Playwright test and choose Inspect Element to open DevTools.
→ Use Ctrl + Shift + I or F12 combination
DevTools Actions with Playwright
- Inspect DOM Elements. You can use the elements panel to examine their properties, styles, and hierarchy to detect issues related to element identification or manipulation.
- Run Console Commands. With the DevTools console, you can execute JS code directly within the browser context to make the testing snippets of code easier or to manipulate the browser state to debug tests.
- Monitor Execution Logs. The console tab in DevTools displays any logs or errors generated during test execution to display more information on JS execution issues.
- Verify Network Calls. With the DevTools Network tab, you can inspect network requests and responses made during the test to identify problems with API calls or data fetching within your tests.
Debugging Selectors in Playwright (Run in Debug Mode Only)
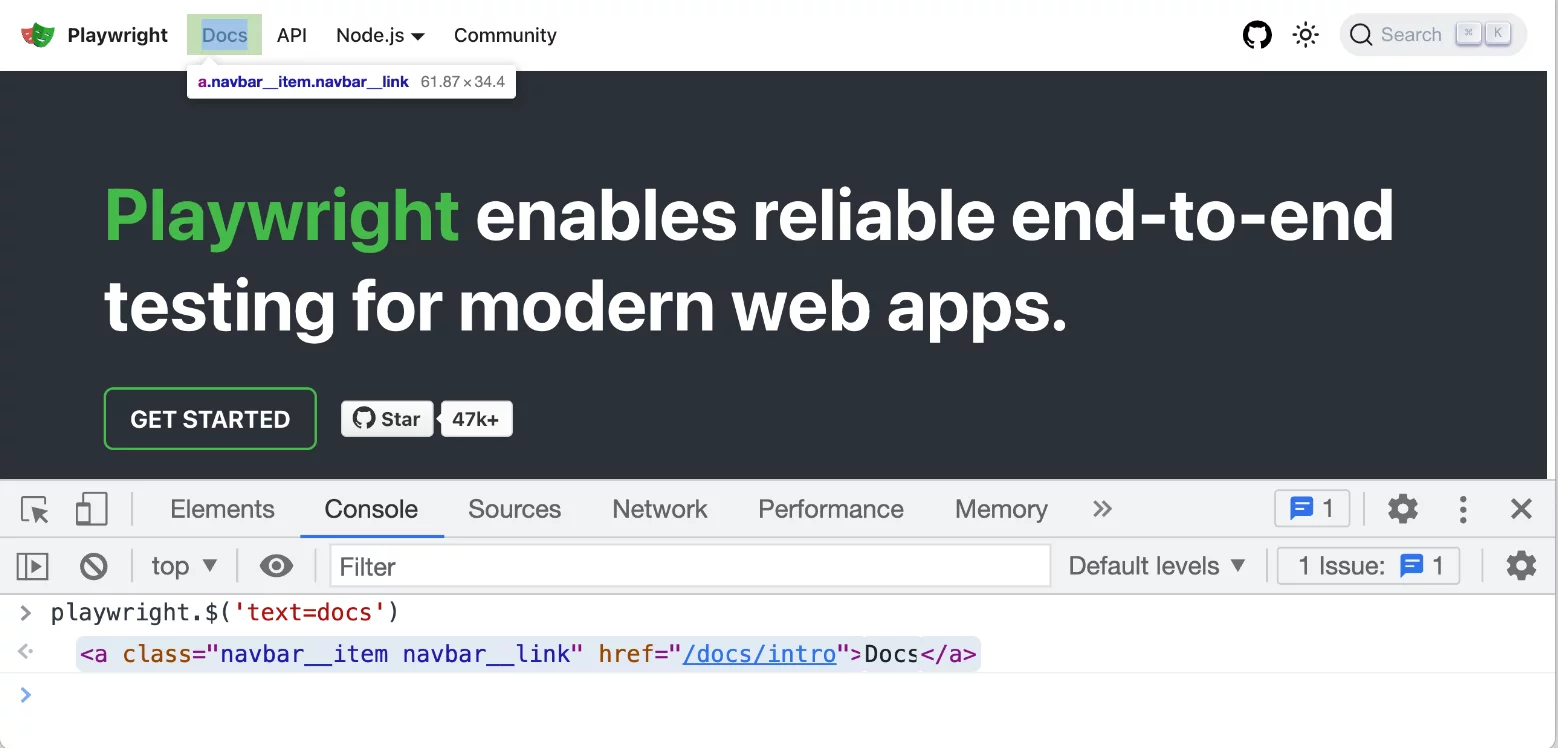
To utilize the Playwright object for highlighting selectors, you need to launch your Playwright tests in debug mode using the PWDEBUG=1 flag. Here we have presented available commands that show the locators:
playwright.$(selector): used to highlight the first occurrence of the selector (equivalent to page.$ in your script).playwright.locator(selector): used to highlight the first occurrence of the locator.playwright.clear(): used to clear existing highlights.playwright.selector(element): generate a selector string based on an existing element.playwright.$$(selector): used to showcase every element that matches your selector.playwright.inspect(selector): used to examine properties and identify the issue more efficiently.
Here is an example that demonstrates using DevTools and the Playwright object to debug the issue.
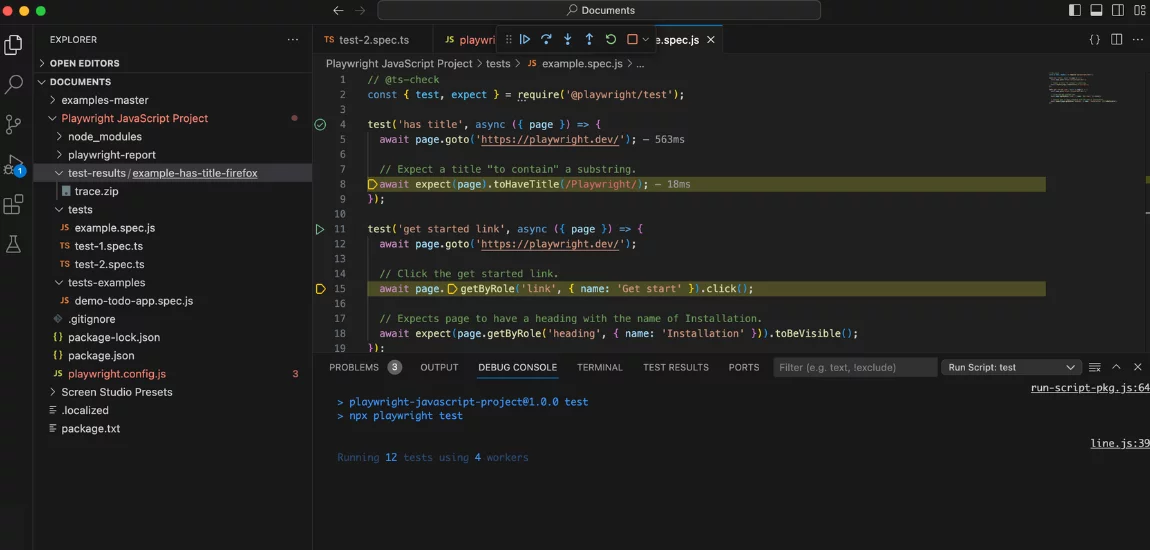
#3: Debugging Playwright Tests in Visual Studio Code
When integrating Playwright with Visual Studio Code (VS Code), you can debug your tests using familiar IDE functionalities like breakpoints. To debug Playwright scripts using VS Code, check the prerequisites :
- Node.js and npm installed on your system.
- A Playwright project set up (including package.json).
How to debug Playwright scripts using VS Code
Configure VS Code launch settings. You need to open the VS Code “Run” menu and choose “Add Configuration.” Then, you should select “Node.js: Launch Program” as the environment – a launch.json file will be created in your project’s .vscode folder. When edited, paste the following code:
{
	"version": "0.2.0",
	"configurations": [{
		"type": "pwa-node",
		"request": "launch",
		"name": "Launch Program",
		"skipFiles": [
			"/**"
		],
		"program": "${file}",
		"runtimeExecutable": "npm",
		"runtimeArgs": [
			"run-script",
			"test"
		]
	}]
}
This will launch your test with the Playwright debugger attached. After that you can debug playwright scripts from the VS Code menu, see in detail the official Microsoft Playwright video:
The execution will pause at your breakpoints, allowing you to step through the code line by line, inspect variables, and debug issues effectively and much more.
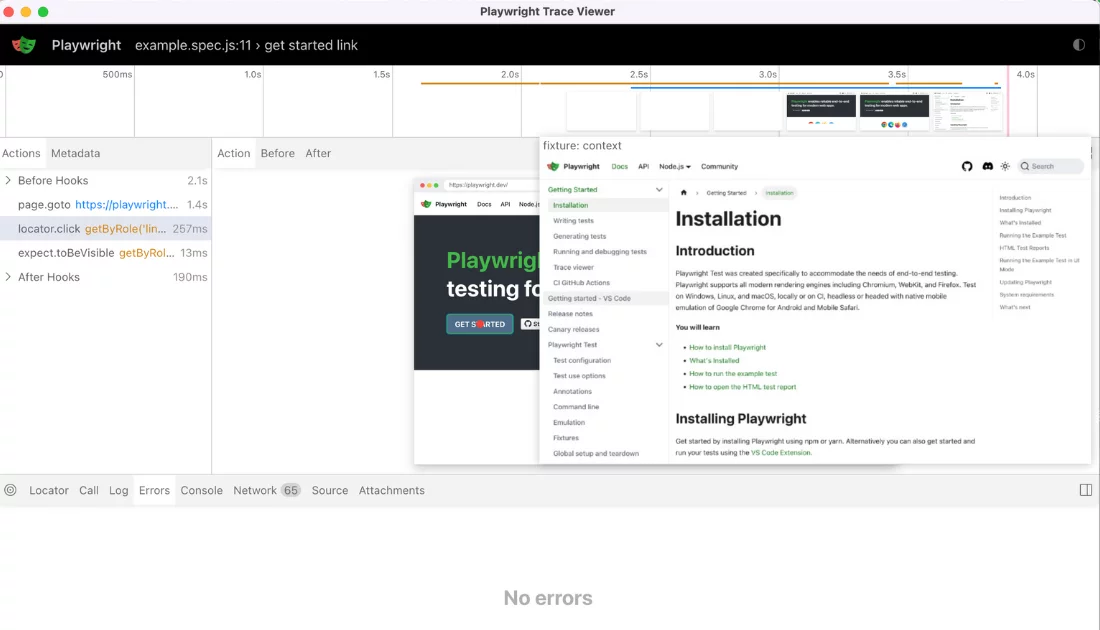
#4: Debugging Playwright Tests with Trace Viewer
Playwright offers a powerful tool called Trace Viewer (follow the Link to find the official Playwright Traceviewer Demo) to better analyze test execution details. Playwright tracing records a detailed log of actions taken during your tests to visualize test actions, inspect logs, and better understand test behavior.
How to activate trace recording
To activate trace recording, you’ll need to configure your Playwright project. Here’s how:
→ Create a file named playwright.config.ts in your project’s root directory. This file serves as a configuration for Playwright.
→ Add the following code snippet to the playwright.config.ts file:
import {
	PlaywrightTestConfig
} from '@playwright/test';
const config: PlaywrightTestConfig = {
	use: {
		trace: 'on' // You can choose other options like 'off', 'retain-on-failure', etc.
	},
};
export default config;
The trace option keeps control of how traces are recorded and includes the following:
- off: disables trace recording.
- on: records a trace for every test execution.
- retain-on-failure: records traces for all tests, but removes them for successful runs.
- on-first-retry: records a trace only on the first retry of a failed test.
Execute your Playwright scripts with the configured trace option. You can explore recorded playwright traces in the test-results directory.
How to use playwright trace viewer
- Trace Files. Once tests have been run, locate the traces.zip file within the test-results directory for a specific test.
- CLI Viewing. Use the following command to view the trace using the Playwright CLI tool:
npx playwright show-trace test-result/./trace.zip🔴 Note: you need to replace it with the actual path to your traces.zip In addition to that, you can view it in the browser by dragging and dropping the zip file to view it in the Trace Viewer UI.
Another way to see your tests in the back machine you can using the following command:
npx playwright test --ui --debugTest management Playwright Trace Viewer Integration
With a single click, open the Playwright Trace Viewer directly from testomat.io The Playwright Trace Viewer integration is designed to empower testers and developers with unparalleled insights into test executions. Take advantage of this feature to streamline debugging, enhance collaboration, and accelerate your testing process as well.
- setup S3 Bucket (see dedicated documentation)
- enable third-party cookies in your browser
- run your tests
- click the test
- click the trace.zip

#5: Playwright Debugging using Playwright Verbose Logging
Playwright logging is another debugging technique. With verbose logging, QA teams get detailed information about test execution in the terminal and analyze script behavior step-by-step. All three commands (Bash, PowerShell, and Batch) are used to enable verbose logging for Playwright tests and then their running:
Bash:
DEBUG=pw: api npx playwright testPowerShell:
$env:DEBUG="pw:api"
npx playwright test
Batch:
set DEBUG=pw:api
npx playwright test
The commands mean the following:
DEBUG=pw:apiused to set the debug environment variable to enable verbose API logs Playwright.npx playwright testused to run your Playwright scripts using thenpxcommand
Once you enable verbose logging, Playwright continuously outputs detailed logs during test execution. These logs can include:
- Information about page navigations, element interactions (clicks, typing), and more.
- Details about HTTP requests made during the test, including URLs, headers, and responses.
- Any console messages (logs, errors) generated by the browser or your test script.
Benefits of Effective Debugging & Tracing
There are many advantages to running and debugging Playwright tests. Let’s discover their top benefits that significantly improve the testing process:
- Reduced Debugging Time. Teams can quickly identify the root cause of test failures, saving valuable time.
- Improved Test Maintainability. With debugging techniques, teams write cleaner and more maintainable test code.
- Improved Confidence in Tests. Thanks to tracing, teams verify that tests are accurately reflecting the intended user journey.
- Faster CI\CD Integration. With debugging and tracing features, teams accelerate troubleshooting tests running on headless CI platforms.
Tips for Running and Debugging Tests
Playwright offers a robust testing framework, but even well-written tests can encounter issues. Here are some essential tips to help you simplify the process of running and debugging your Playwright tests effectively:
- Modularize your tests. You need to structure your tests to run and debug individual tests or components independently. This helps isolate and address issues efficiently.
- Manage testing data. You need to think of an effective strategy of test data implementation. It is essential to rely on consistent and reliable data during execution.
- Version Control. You need to keep your Playwright code and test scripts under version control (e.g., Git) to track changes and revert to previous versions if necessary.
Bottom line:
Want to boost your software’s reliability with Playwright debugging and tracing?
By mastering debugging and tracing in Playwright, you can significantly improve your end-to-end (e2e) tests. Early detection and a commitment to a smooth user experience become achievable goals. With the right tips and techniques, you can write and maintain Playwright tests with confidence and get great testing results.
Practicing debugging and tracing, you will deliver exceptional value and provide the reliability of your software products as well as ultimately improve customer trust.
👉 Drop us a line if you want to discover more details about debugging and tracing with Playwright.