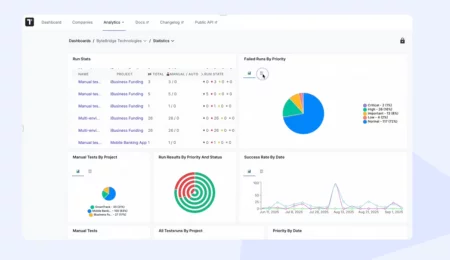
Testing analytics
Benefits of testing analytics
Testomat.io testing analytics features
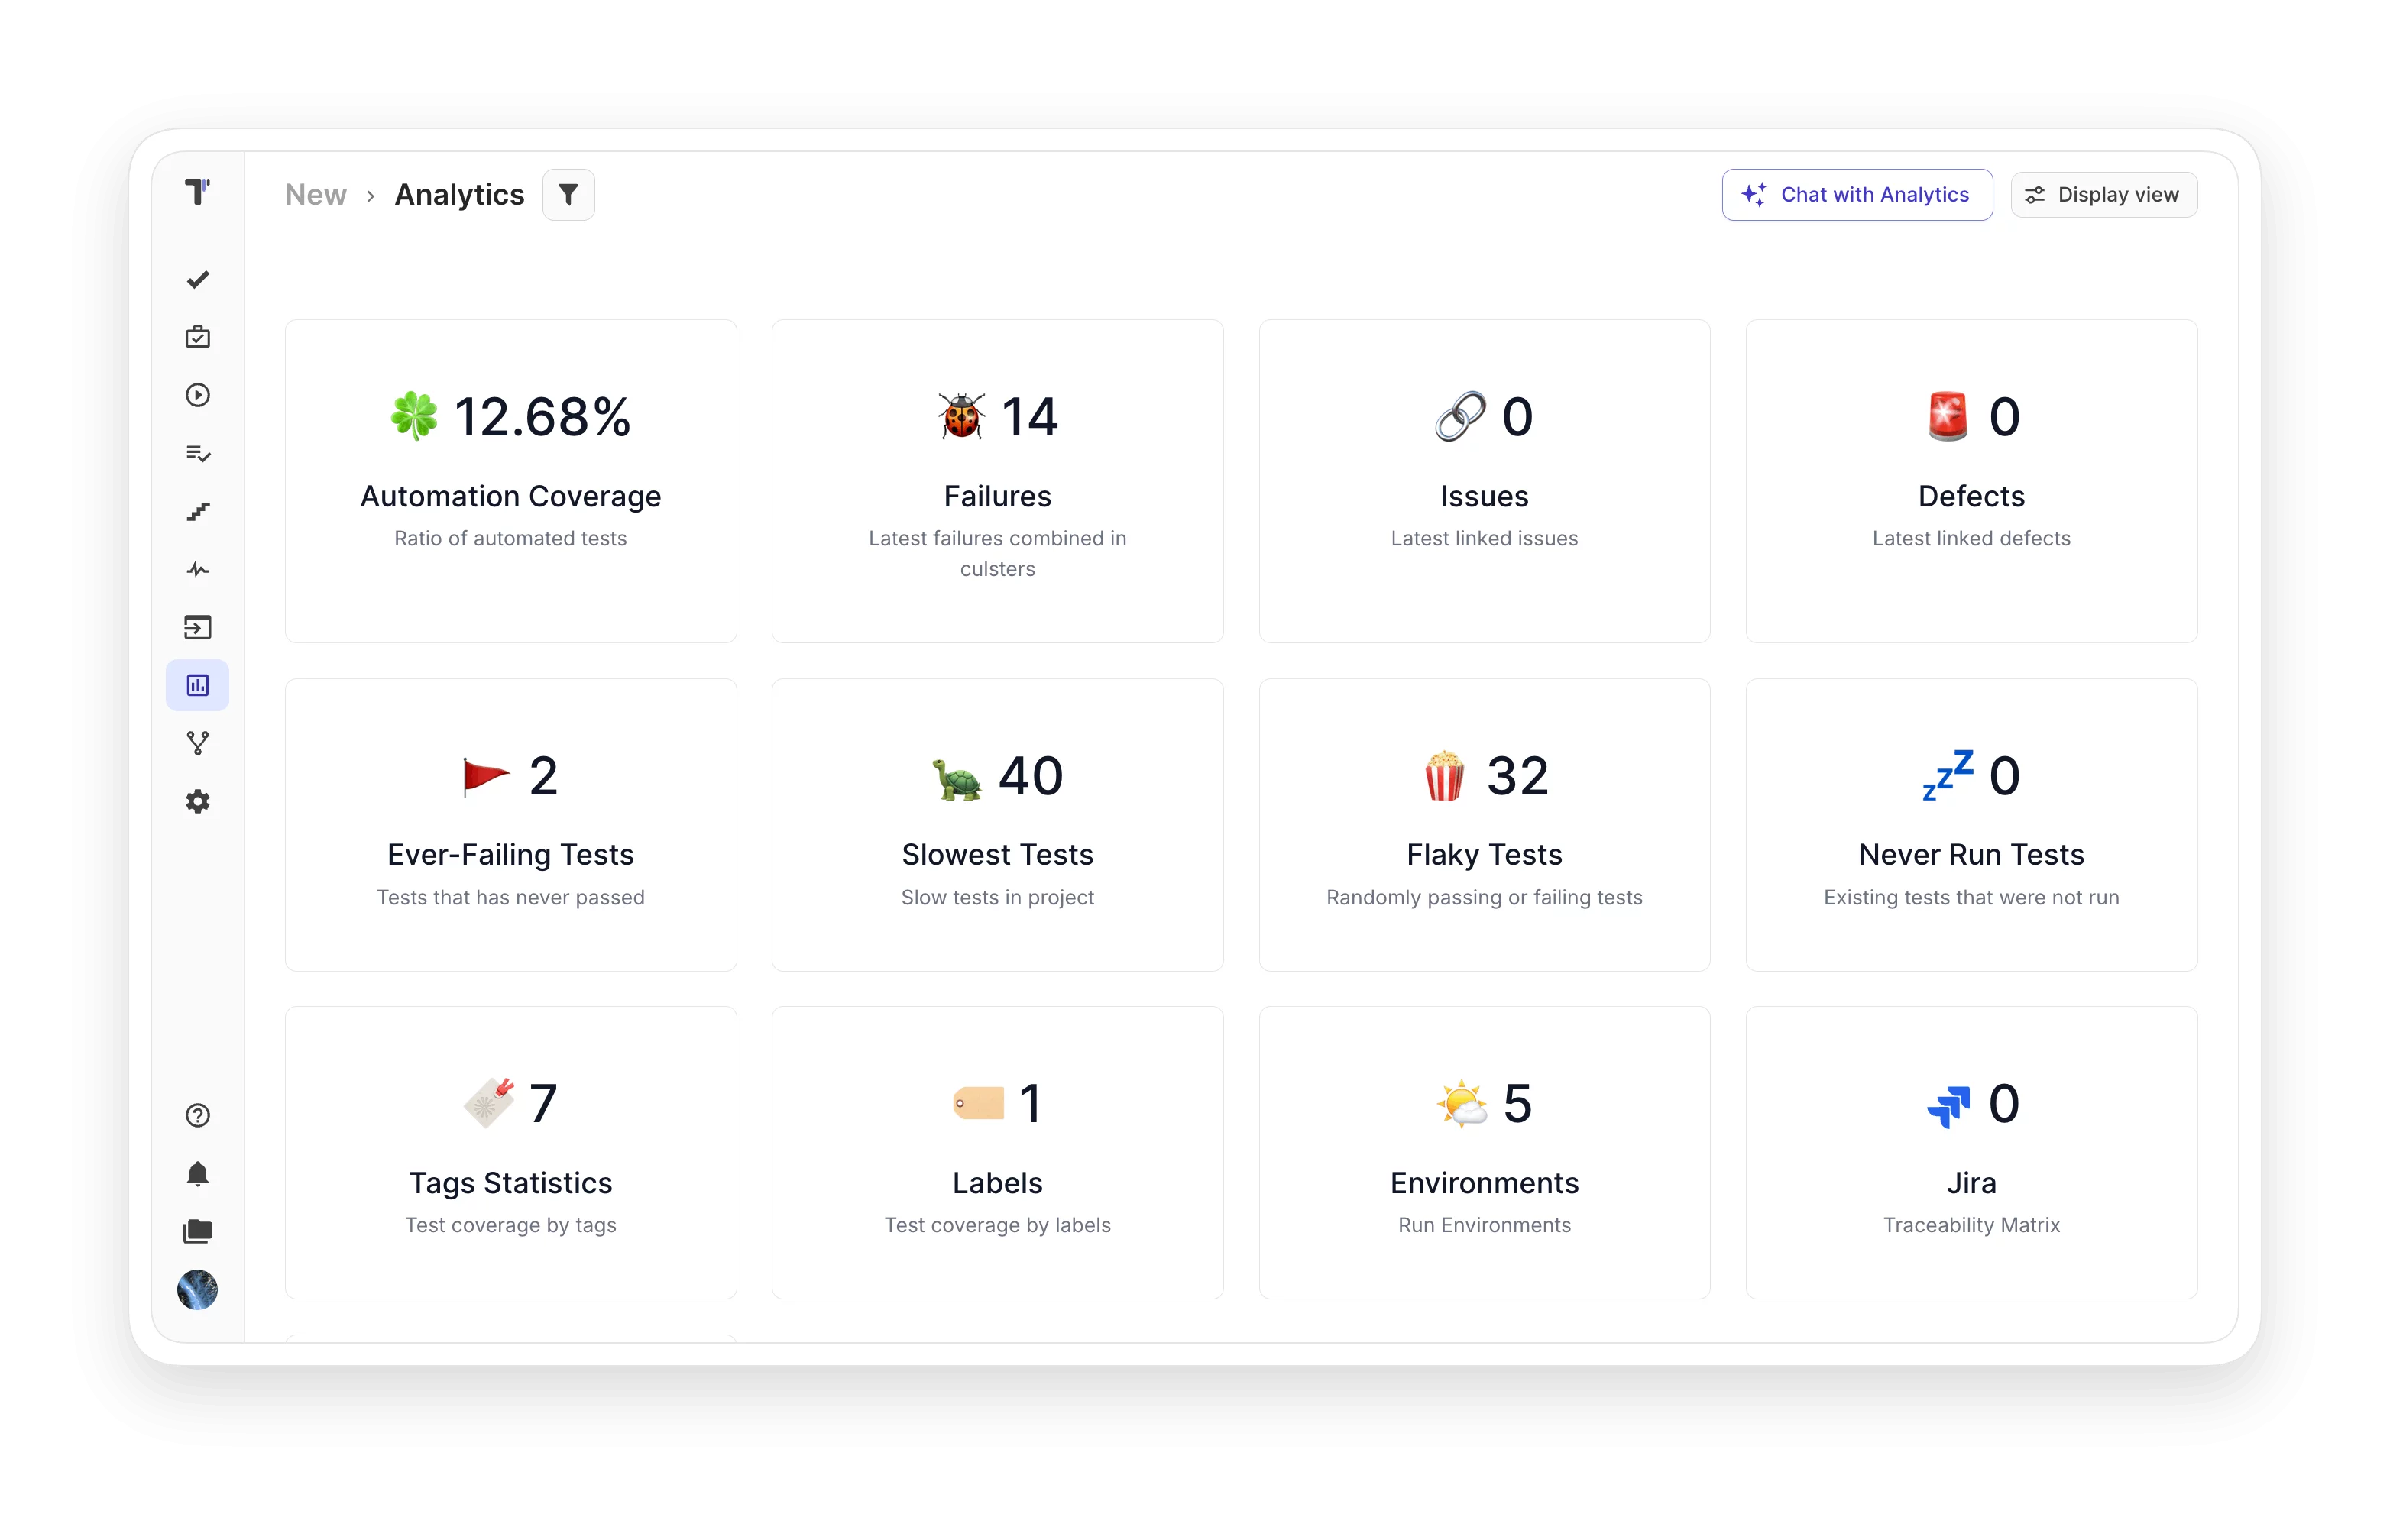
The automation coverage board displays the percentage of automated tests on the project, so teams can track progress over time.

The defects board surfaces issues from the latest runs, defect rates, and clustering. Filter results by quantity or by date of occurrence.
Get coverage reports for requirements linked to tests and defects through the advanced Jira plugin. Link tests to user stories directly from Jira.

Detected flaky tests appear automatically on the widget. Configure flakiness thresholds yourself to decide which tests should be marked unstable.

Make the slowest tests visible by sorting them over a period from a millisecond threshold you define, so you control what counts as slow.

These metrics measure the scope of imported but unexecuted tests. They reveal how complete and relevant your testing set is for the automation team.

The Tag Analytics widget shows a heatmap, automation coverage, and run status grouped by tags. These metrics help you track and improve your tests.

The analytics dashboard fetches data from all your projects within a company. Track Flaky tests, Success Rate, Slow Tests, and Automation Coverage globally.

Apply environments to manual or automated tests and suites. This metric shows a heatmap, automation coverage, and run status by test environments.

Keep track of tests that link to Jira, so you can follow project progress and report it to your stakeholders.

This metric collects information on tests linked to Jira stories through the plugin and displays Automation coverage and Success rate within the Jira project.

Study the summary statistics for any test runs you care about, and draw conclusions on how the project is developing.

How testing analytics can help?
Recent reviews


Frequently asked questions
What is analytics testing?

What is the best analytics for beta testing?
What is data analytics testing?
How to automate security testing for analytics?
What is analytics testing in software testing?
