Test analytics and reporting are the key stages in test automation flow. Monitoring with test automation metrics ensures that everything is going well, as defined by the test strategy. In particular, are resources and testing efforts focused on essential areas of the software or not.
The team of testing tool testomat.io perfectly understands how much qualitative software testing analytics is in demand by Agile teams.
Agile software development is all about speed, so Automation QA teams make automated tests a part of the CI\CD pipeline to speed up testing and achieve product delivery without delay. It’s, test automation analytics is necessary for launching effective CI\CD pipelines for Agile teams.
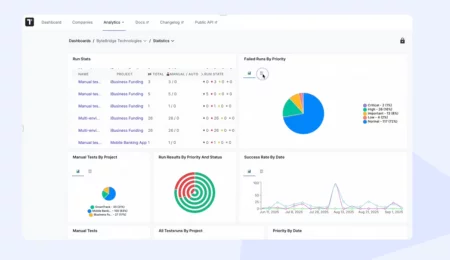
That’s why we’re continuously developing the Analytics Dashboard in our test management solution by expanding software testing metrics as quantifiable indicators. Also, we implemented an Analytics widget with a few significant metrics as the subsection into Test Reporting. Of course, it is handy to fast-track metrics here without the necessity of moving to other tabs.
Analytics with test management cover the next goals:
- Evaluation
- Control
- Anomaly detection
- Finding growth opportunities in test strategy
- Improving collaboration
- Business presentation
Rich analytics and reporting boost business confidence in the quality of the product, as well as in the reliability of the test team. When the QA Manager or QA Lead presents test results.
How to using analytics to support your test automation strategy?
Agile teams might use many options for QA metrics in their daily activities, but our test management solution collects the most widely used automation metrics for test analytics. We suggest the QA manager or QA Lead consider tracing the following metrics while managing the testing process.
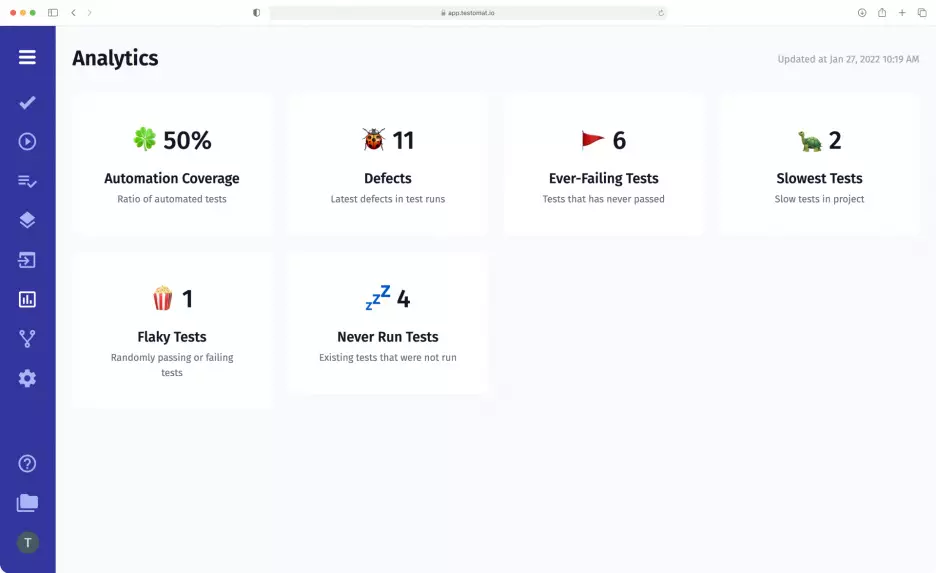
This test analytics widget:
- Automation Coverage – this testing metric allows the QA Manager to track the progress of automation on the project. It allows knowing how many tests are automated in some part of a project as a ratio to the manual testing part by folders and suites.
- Defects – on the Defects Dashboard, you may see the list of defects per period of time.
- Ever-failing tests – metrics display tests that aren’t fixed for a long time.
- Slowest tests – detect slow tests determined by your requirements needs. You can set up your own testing time in settings. On the other hand, with a new commit of code occurring and the pass rate drops, it’s a flag indicating possible degradation of software.
- Flaky tests – widget automatically catches and displays flaky tests. And you save time investigating fails. Flaky test detection is useful not only for finding failures but also in understanding the stability of your suite.
- Never run tests – metrics measure the scope of imported but unexecuted tests.
- Tag statistic – is a collection of tests by a certain @tag.
- Aggregated analytics across different projects – fetches data of all your testing projects within a company. Plus filtering by projects and data maturity.
Test analytics is open on the paid subscription. Visit the following URL to know all the software testing metrics implemented on the test management Analytics Dashboard. Now let’s step it out:
Why Analytics is important in Test Management and you should turn on it?
- Real-time Analytics and Reporting allow feedback only one test is completed. QA team need not wait until all tests will be executed. It’s a perfect option for high-scaled testing projects, in case test running goes for hours. Possible start bug fixing till the test will finish. But you need to time testing activities so that reporting and analysis are delivered at the most relevant time in your development pipeline.
- Software testing metrics are quantifiable indicators of software testing quality and overall code health. Test analytics provides an objective, deeper understanding of your testing framework and tests. It helps to detect errors fast, identify hotspots of defects and track their localization, boosting the QA Automation team’s efficiency and productivity.
- Calculating testing metrics manually is a time-consuming process, so implementing test management saves QA managers time. Also, test management analytics is an important step in ensuring data integrity. Metrics record and display historical timeline. It is actionable information to make improvements.
- Analytics works with your data. Analytics widgets pull test data automatically. Analytics extracted from the test management app will be an excellent basis for building higher-level analytics next critical product improvements. QA Managers can reuse these analytics for other purposes by any means. Present Report and Analytics to stakeholders.
- Once automated tests become part of your CI\CD, test automation analytics is necessary for running effective CI\CD pipelines for Agile teams.
- The end goal advantage when you’re implementing test automated analytics is to create a culture of collaboration among the various teammates involved in software delivery (Developers, Quality Assurance, Business Analysts, management, etc.) Understandable analytics allows all these participants to be on the same wave.