




Test automation coverage
Trusted by over 500 forward-thinking companies
















How test automation coverage works in Testomat.io


How test automation coverage can help?


Testomat.io test automation coverage features
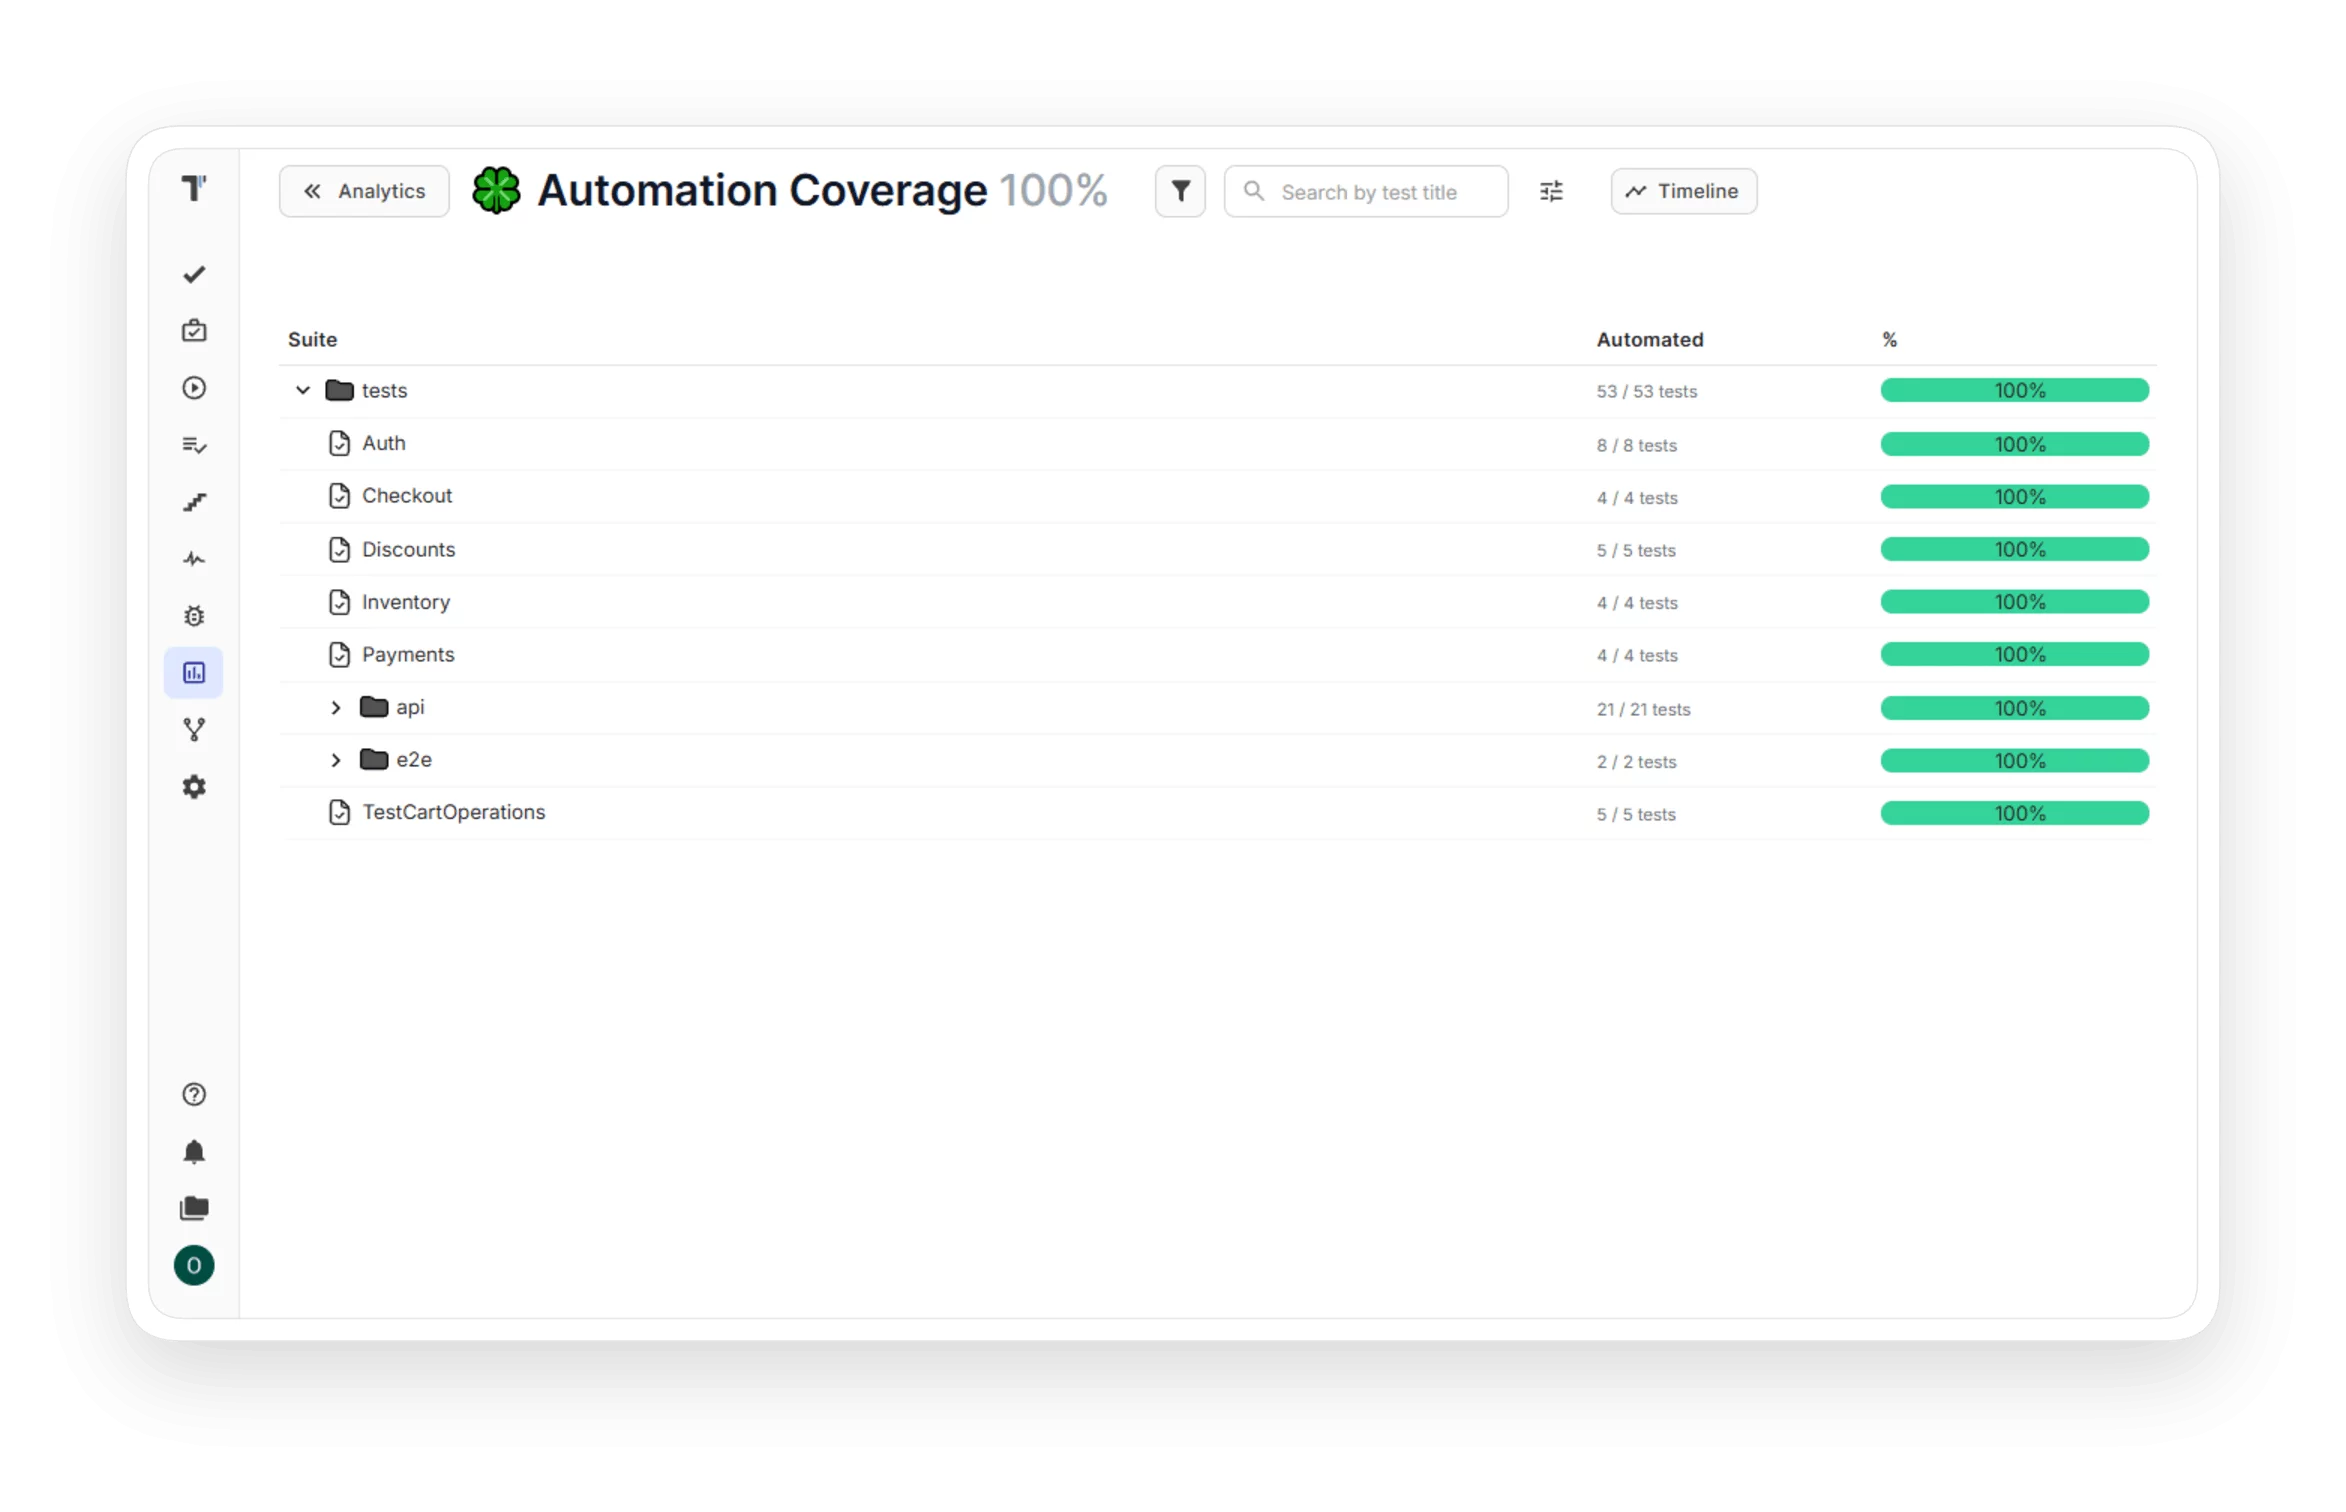
The board shows the automation progress of your project as a percentage, with exact numbers for each suite. You see which areas run on automation and which still need work. The team plans automation with real numbers and shares the progress with a link.
- Automation percentage per project.
- Breakdown by suites.
- Automated and manual test counts.
- Shareable link to every board.

Separate boards list flaky and slow tests. Two more boards show tests that always fail and tests that never ran. You find weak tests without reading logs, so the suite stays reliable and the team trusts the reports.
- Flaky tests board.
- Slowest tests board.
- Ever-failing tests board.
- Never-run tests board.

Timelines and custom charts track coverage and test metrics over any date range. You see how the numbers change and follow the metrics your team defines. The charts support quarterly planning and prove the value of automation to management.
- Timelines for coverage and failures.
- Custom date range for analytics.
- Custom charts with own queries.
- Chart export to PNG, SVG, CSV.

Testomat.io links tests and suites to user stories and builds a traceability matrix. Each story shows its tests and runs, and AI suggests missing tests for a requirement. You add the missing tests before the release.
- Tests and suites linked to user stories.
- Test coverage visible in Jira.
- User stories traceability matrix.
- AI review of requirement coverage.

Why teams choose Testomat.io test automation coverage



Start working with Testomat.io today


Recent reviews






Frequently asked questions
What is test automation coverage?


How is the automation coverage percentage calculated?
Can I filter the Automation Coverage table?
Should I aim for 100 percent automation coverage?
Why does test management need a coverage metric?
