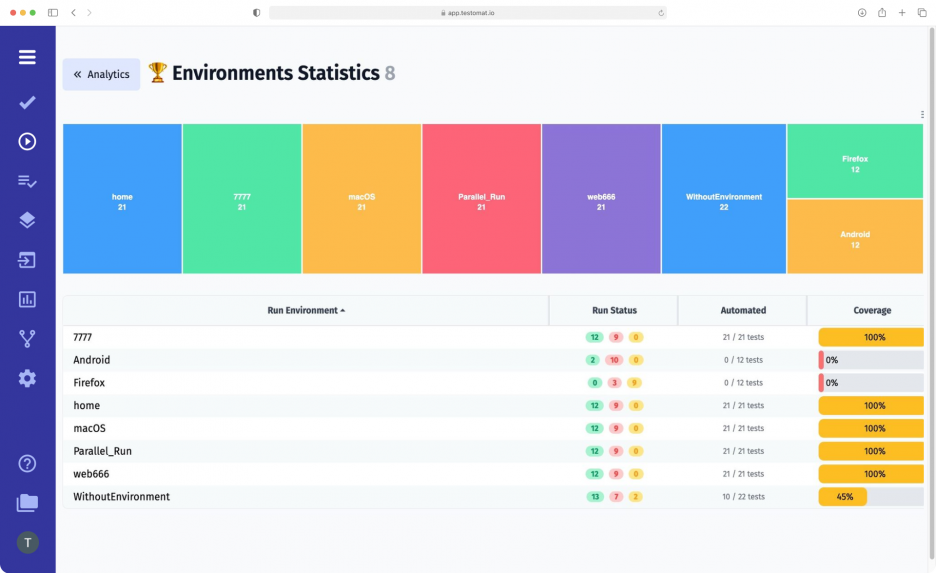
The development methodologies used by today’s teams involve close collaboration between technical and non-technical people. In order to provide this opportunity, we need progressive tools that allow you to get up-to-date information about the project, presented in a human-readable format.
Working on testomat.io test management, we try to implement all the necessary features to meet the needs of Agile teams. One of them is the Analytics dashboard, in particular, the Test environment management widget, which provides analytical data about the test environments used on the project.
How the Environments widget works
This metric can be used by any team member when working with both manual and automated tests and displays their results:
- in the manual run, you select the test environment, that is, the platform (Windows, macOS, Linux, Android or iOs) and browser (Chrome, Firefox, etc.), in the Set environment for execution field;
- during the automated run, you add a test environment to the console, where you write the command to run the tests.
At the end of the run, all the selected test environments will end up in the Environments widget. That is, it accumulates all the test environments that are used in the project.
Test environment management possibilities
To make using the function as convenient as possible for our test management app users, we have implemented a number of additional options:
- Heatmap. All the data in this widget is grouped into a multi-colored table for better visual perception. Heatmap can be downloaded in one of the formats: SVG, PNG, or CSV. It can be useful for specific test summary reports, or you can share it with a client for a more visual presentation of the results of QA team work.
- Run Report. By clicking on the test environment you are interested in, you will get access to the list of Run reports that contain that environment.
- Tags. In the Environments Statistics window, it is possible to filter test environments by the assigned tags. Select the desired one, and the heatmap will change to present only those test environments that contain the selected tag. In addition, you can filter by test environment name and Jira Issue with @Tag.
- Sorting. You can sort test environments by name and test status of the run.
Add the desired test environments manually
During a manual run, you can specify the environment in which testing will be performed. Our TMS provides the ability to configure a list of available environments. To do this, select the Settings Environments menu on the test project dashboard. A window will open with a list of all existing test environments in the system. By clicking on it, you will be able to edit this list – add new and delete irrelevant ones.
The Environments widget will also be useful when using other features of test management:
- CI\CD execution – CI\CD’s goal is to accelerate the release of a high-quality product to market. To achieve it, teams need a test case management tool that is easy to use and provides up-to-date information on test results. That’s what the Test environment management function was introduced for; you get complete and visualized information about the test project promptly with it.
- Testing analytics – in the presented widget, you can see how many tests are passed, failed, and skipped for each environment, as well as the number and percentage of automated and manual tests.