

To ensure that software testing yields the expected results, it is not enough to simply create test cases and run them in the chosen testing environment. Another equally important aspect is obtaining high-quality reporting on test results. Most modern testing automation platforms provide effective tools for creating reports, allowing tracking of skipped, passed, and failed tests on a project and, more importantly, understanding the reasons for errors.
In Cypress, all the mentioned capabilities and many other features are implemented in Cypress Dashboard, which its creators recently renamed to Cypress Cloud. We will delve into what it is and how to work with it ⚙️
What is Cypress Dashboard
Using the Cypress test runner, you can run tests in parallel with your app, allowing you to see assertions, network requests, browser events, and other commands directly in the browser. This contributes to the quick execution and debugging of tests.
When running tests in a CI pipeline, visibility into the process is partially lost. CI essentially represents a black box that does not allow you to fully see how your app behaves. This is a significant problem for testing modern web apps, as they are highly dynamic and require a high level of visibility and sufficient details for debugging.
Cypress Dashboard helps address these and many other issues – a web component that provides full visibility into your test runs in the CI pipeline, allowing you to control their status and examine reports on test results. Additionally, it speeds up testing, accelerating the release of high-quality software products.
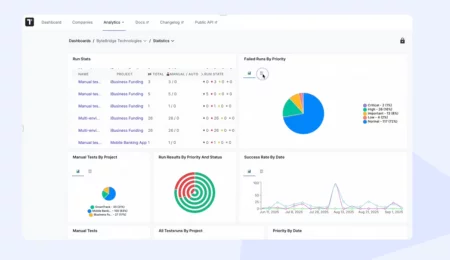
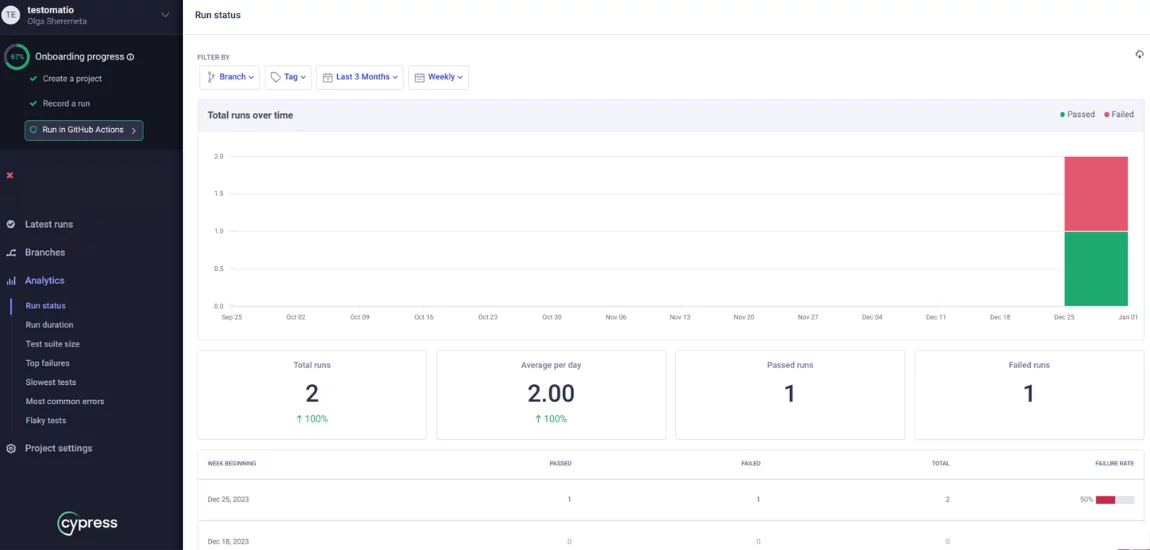
To see all the necessary information for a Cypress project, click on its name on the dashboard. Among other data, you will have access to information about the number of passed and failed tests and the duration of the test run.
You can filter and group all test runs by various properties – this feature is especially relevant when working on large projects where developers add large amounts of code daily. Among other dashboard features:
- Viewing statistics for skipped, passed, failed, and pending tests.
- Examining the stack trace of failed test cases.
- Representing spec files as a histogram allows you to visually identify those that took the maximum amount of time to execute.
- Support for screenshots and videos for even greater clarity when examining testing results. Note: you can view both the full video of the entire test run and its excerpt.
- Test parallelization feature speeds up the testing process as the codebase and test run duration increase. All that is required is to specify cypress run – record – parallel when launching it in CI. After that, Cypress will automatically determine how to balance the load of all spec files on multiple machines in the CI.
As such, Cypress Dashboard is an indispensable tool for all users of this framework who run testing in the CI pipeline and want to achieve optimal visibility throughout the testing process from start to finish.
How to Run your testing with Cypress Dashboard
To create and run a Cypress test, you first need to install the framework. You can do this in several ways:
Via npm:
npm install cypress --save-devWhen choosing this option, it’s important to ensure that you have npm init running, a node_modules folder, or a package.json file. This ensures that Cypress is installed in the correct directory.
Via Yarn:
yarn add cypress --devVia pnpm:
pnpm add cypress -DThe all installation details you can find in the official Cypress Docs that definitely is a strong point of this testing framework.
After installing and opening the framework, you can open the Cypress App with the command:
npx cypress openAfter choosing of E2E or Component Cypress types of tests Create new empty spec file with the button to create your first test:
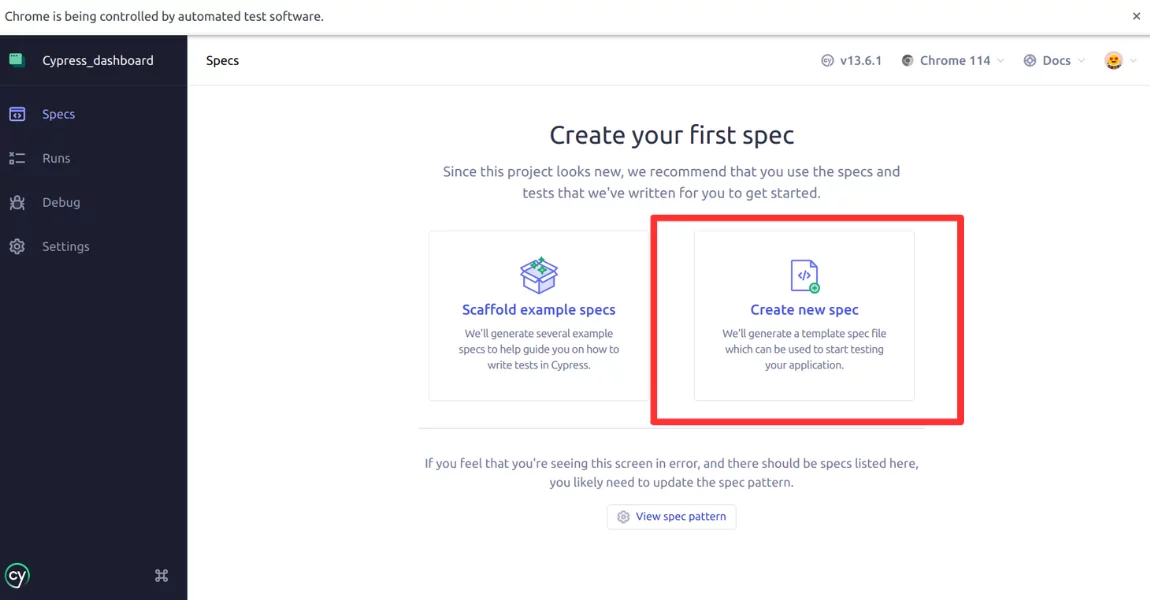
Now, add a name for the new specification and create your first test file within it; let’s call it first-test.js.
Next, run tests in the Cypress window or through the Command Line Interface (CLI) using the commands
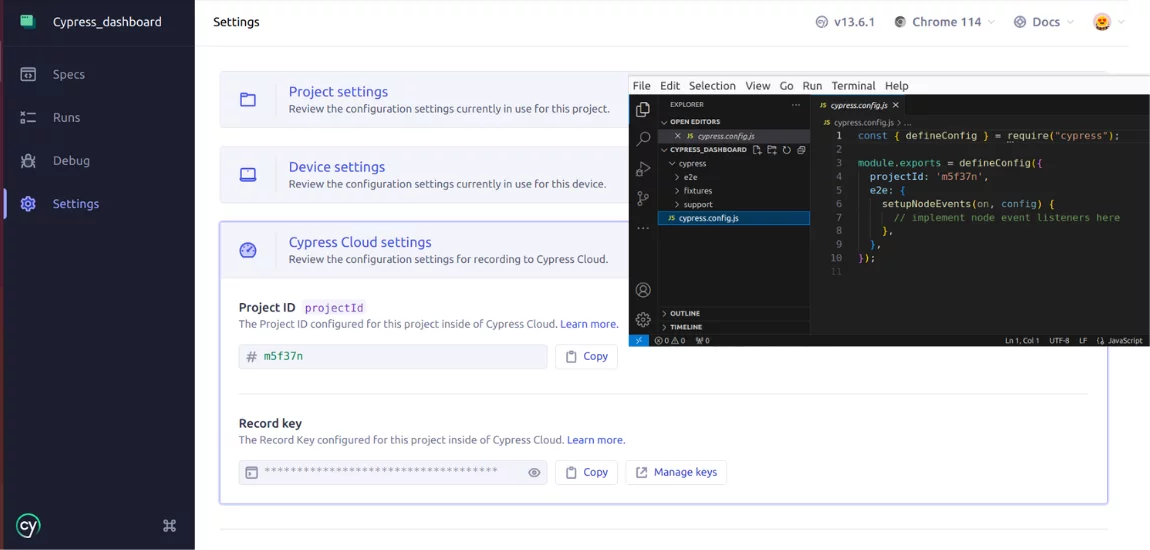
npx cypress runNote one more time, that Cypress Dashboard recently changed its name to Cypress Cloud, to enable the test recording in your Cypress Cloud you should follow the Dashboard tips and establish run connection to a project within the interface and check the project settings cypress.config.js file.
After then run the following command:
npx cypress run --record --key <your key>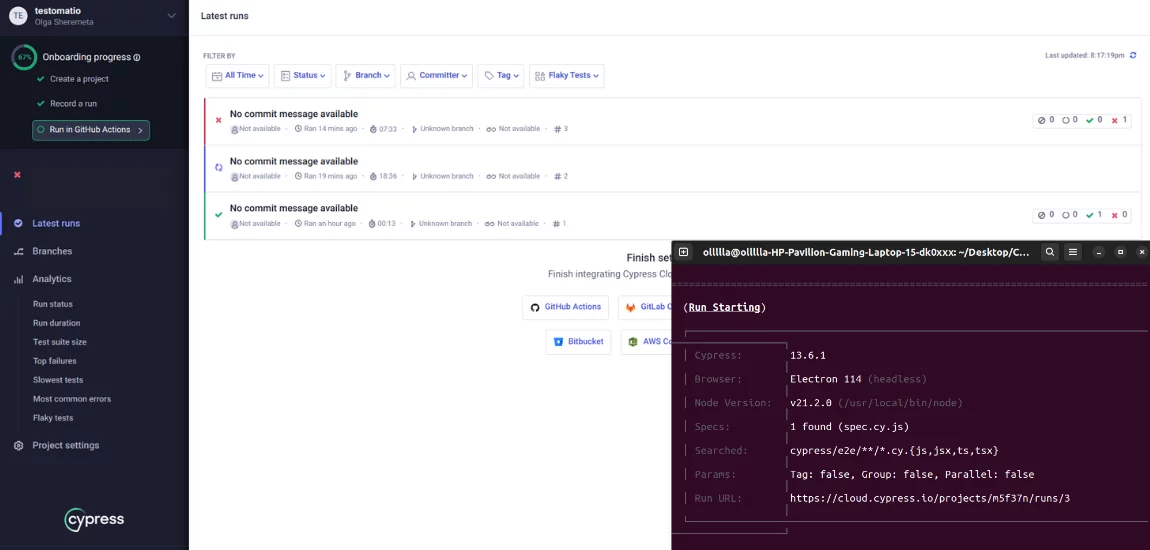
As a result follow through the link of run and you can track result of your tests in Cypress Cloud as well.
Cypress Tests on CI\CD from Cypress Cloud
Another capability the Cypress framework provides is the ability to run tests on CI/CD. Smart Orchestration of Cypress Cloud enables you to run tests with your favorite CI\CD tools in your CI environment and coordinates runners and balances test loads out-of-the-box. Essentially, to run Cypress tests on CI/CD, as example GitHub Action only 2 steps are required:
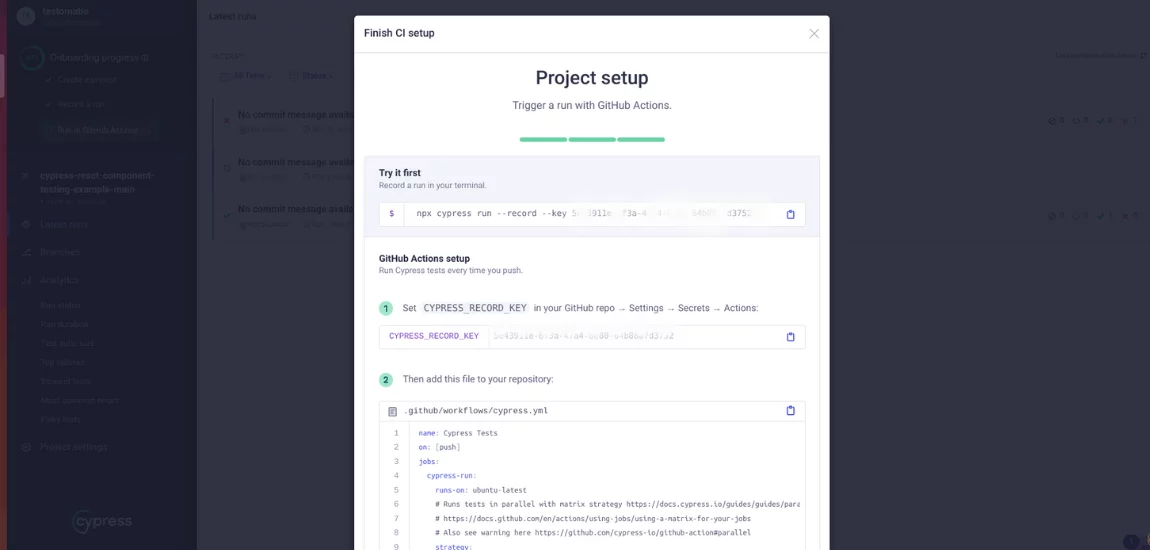
Of course, that depending on your CI provider, you may need a specific configuration file. Information about the required file and its installation can be found in such tips. After setting up testing in the CI pipeline, Cypress will record tests and save test results in the Cypress Dashboard.
Test execution results includes test run statistics, specific failure details, and deep links to results in Cypress Cloud for fast debugging.
Cypress Cloud’s Spec Prioritization lets you prioritize recently failed specs so they run faster on their next run. The Auto Cancellation feature will cancel a whole test run on failure, saving time and resource usage. You can also cancel in-progress runs manually from Cypress Cloud if you need to.
Cypress Limitations 😢
Some limitations in the Cypress framework lead QA teams to seek alternatives to this platform. These include:
- The framework does not support working with mobile applications. The tester can only check specific functionality in the mobile browser.
- Cypress works only with one programming language – JavaScript.
- Simultaneous control of multiple browsers and support for multiple tabs are not available.
- Test results tracking is possible through Mocha.js reports, on which Cypress is built, or by using the web component Cypress Dashboard.
On the other hand, there are also open-source alternatives, which we would like to discuss with you at the bottom.
A free Cypress Dashboard Alternative
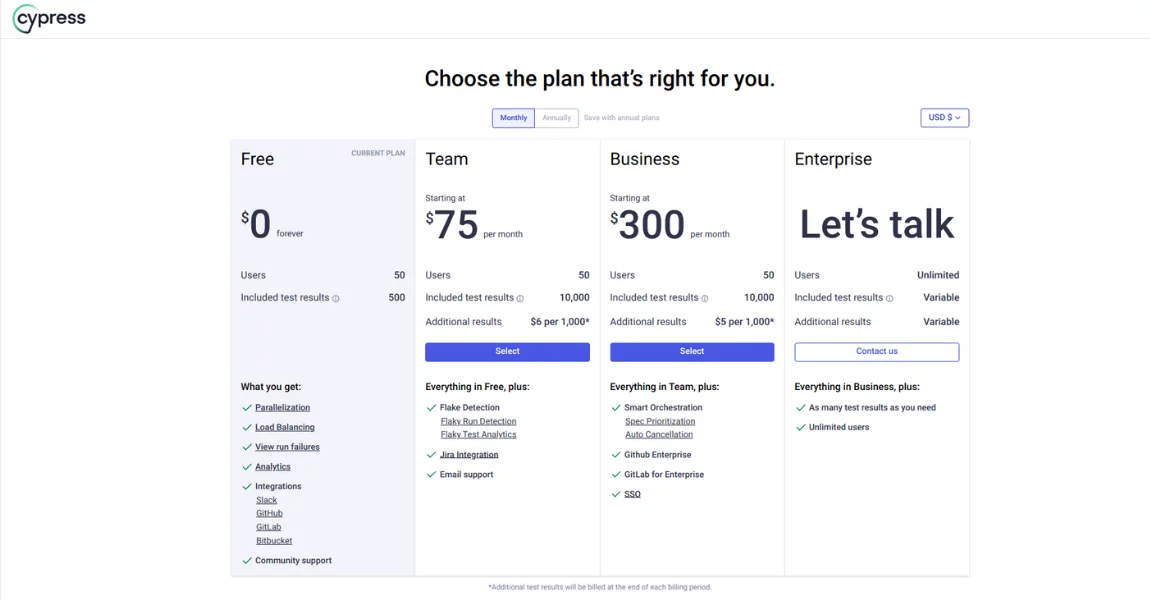
Cypress Dashboard is the most popular solution for tracking results of Cypress tests, used by global giants like PayPal, Disney, etc. However, this tool comes with a relatively high cost, which can be a significant issue for small teams using this framework.
Fortunately for Cypress users, Cypress Cloud has a free alternative – Sorry Cypress and its enhanced version Current. They are used for parallelizing, recording, and debugging Cypress tests. They are open-source and has an MIT license.
It is worth noting that debates are ongoing in the testing community regarding the legitimacy of having a free alternative to Cypress Dashboard. However, the projects are not closed at present, and all framework users can work with the alternative panel starting from version 6.7.0.
Key features of Sorry Cypress project :
- Parallel test execution for faster testing in the CI pipeline.
- Group tests by browser or device in a single test run.
- Identify flaky tests.
- Record videos and screenshots and access the stack trace.
- Track the duration, status, and progress of test run, spec files, and individual tests.
- Integration with GitHub, Slack, MS Teams, Webhooks, and other third-party services.
As you can see, Sorry Cypress’s functionality is on par with the original solution – Cypress Cloud. The only question remaining is the ethics of using free software as an alternative to the official digital solution from the Cypress framework developer. And on a moment of article publication it works with elder Cypress versions.
Testomat Differences with the Sorry Cypress
Test management system testomat.io is a modern test management system for working with Cypress tests. This is made possible by the convenient TMS function – importing automated tests from other systems. After importing Cypress tests, users can run tests and use Project Dashboards in test management to study test results and their deep analytics.
Project Dashboards in Testomat.io offer capabilities different from Sorry Cypress. Here’s what we provide:
- Tests: Users can access all actions with tests in this dashboard. In addition to viewing test cases, users can create, delete, or import tests.
- Runs: All test runs are stored here, and you can view results at any time. Users have access to graphs based on test status – failed, passed, or skipped tests.
- Parallel test execution: this testing tool supports both sequential and parallel QA processes. Unlike Cypress, TMS supports testing web applications and mobile digital solutions.
- Also available here are the sections Runs Archive and Groups Archive: They contain information about tests that were run previously. You will be able to see the date of their execution, the time spent, the ratio of tests based on their status, as well as their total quantity in each test run.
- Pulse: This dashboard allows users to recover tests deleted within the last 90 days. Users can also analyze all changes made to them, filtering content based on various indicators, such as the date of change or the responsible user.
- Imports: This dashboard contains information about when and which tests were imported into TMS. Users can track the dynamics of testing here.
- Analytics: Widgets in this dashboard provide QA teams with deep project analytics. Information includes metrics such as:
→ Automation Coverage – the number of automated tests.
→ Failures – defects in the project.
→ Ever-Failing Tests – tests that have not received necessary fixes for a long time.
→ Slowest Tests – tests indicating performance issues or automation errors.
→ Flaky Tests – tests showing different results in each test run despite no changes in the test code.
→ Never Run Tests – test cases imported but never run.
→ Tags Statistics – automation percentage and test status based on used tags.
→ Environments – the same metrics as the previous point, but broken down by test environments.
→ Jira – information about tests linked to the Jira system. - Wide integration possibilities: our test management solution seamlessly integrates with the Jira system and popular CI providers, including GitHub, GitLab, Jenkins, etc.
- Team collaboration on a project: This is primarily possible thanks to the clear Living Docs documentation and BDD-format support of tests.
- Plans, Steps, Branches, Settings, Help. While not directly related to tracking test results, these dashboards, available in Testomat.io Project Dashboards, offer additional functionalities:
→ Users can create, modify, delete, or launch individual test plans in the Plans menu.
→ Steps represent a database of steps that can be reused when creating test cases, speeding up the process.
→ In Branches, users can create, modify, and delete test set branches, allowing testers to work on different tasks simultaneously, speeding up the testing process.
→ Converting manual tests to automated. Simply write test scenario steps and code for their automation – TCMS will mark the necessary tests as “automated.”
The Settings menu provides TMS users with many options for optimizing testing. Regarding reporting, users can modify test result message templates and configure notifications for completed test runs.
Sum Up: Is Cypress.io Dying?
Cypress was initially positioned as an open-source solution with rich functionality, quickly gaining a large audience of enthusiasts. However, over time, many users were disappointed by the introduction of paid web components necessary for the framework’s operation – one of which we discussed today, namely Cypress Dashboard.
This situation prompts many Cypress users to seek alternatives to the familiar tool, opting for Playwright, Selenium, or other platforms with similar functionalities. Despite this, it’s too early to speak of the definitive “demise” of Cypress.io – teams continue to work on it, particularly those finding it challenging to transition their projects to other platforms or those guided by personal preferences.