

During the testing of our software, we have to be sure that everything is going well and that our test process is moving in the right direction. How should we know that?
Software testing metrics are a way to measure quality and monitor the progress of your test activities. Test metrics give us better answers than just we have tested it.
What are KPIs
KPIs (key performance indicators) are measurable values that show how well a team is meeting its goals. In software testing, they turn raw test data into clear signals about quality, progress, and risk.
Put simply, a testing KPI tells you whether your test process is on track, not just that tests ran.
This guide explains testing KPIs and the indicators behind them, the difference between KPIs vs metrics, and the QA KPIs worth tracking across monitoring, test effort, coverage, and cost. You will also find examples for performance testing KPIs, test automation KPIs, and AB testing KPIs, plus how to calculate them.
During the testing of our software, we have to be sure that everything is going well and that our test process is moving in the right direction. How should we know that?
Software testing metrics are a way to measure quality and monitor the progress of your test activities. Test metrics give us better answers than just we have tested it.
What are the benefits of QA metrics?
- QA testing metrics gives us knowledge: How many bugs found were fixed? reopened? closed? deferred? critical among them?
- Defect metrics in software testing diagnose problems, help verify and localize them.
- Help identify the various areas that have issues in the software testing process and allows the team to take effective steps that increase the accuracy of testing.
- Predict risks in our testing as an early warning of an unfavourable result.
- Give an understanding of what exactly needs improvements in our testing strategy to optimize processes.
- Allow us to make the right decisions.
Eventually, testing metrics help validate is your product meets customer expectations 👨👨👧👦
To measure the velocity, efficiency and relevance of these, two types of software testing metrics exist:
→ Indicators.
→ The KPIs.
The difference between KPIs and indicators
The 𝗞𝗣𝗜s are derivative trends calculated from the indicators (fundamental absolute numbers) of concrete results of the test campaign. Different QA teams measure various aspects within their testing depending on what they want to track, control or improve. Note, you can determine the set of indicators over the week, month, year or another period.
You cannot improve what you cannot measure.
Presented below test metrics in software testing allow you to quantify the different scopes and actions contained in the latter.
Indicators
- Number of requirements: This is the overall perimeter of the change.
- Number of requirements tested: This indicator lets you know the number of requirements with at least one test case.
- Total number of test cases: A test case corresponds to a verification scenario of the acceptance criteria of a requirement.
- Number of test cases run: Number of test cases executed at least once.
- Number of designed test cases: The number of test cases built, not reviewed and not executed.
- Number of reviewed test cases: Number of test cases built, reviewed and not executed.
- Number of successful test cases: Number of test cases built, reviewed, and executed successfully.
- Number of failed test cases: Number of test cases built, reviewed, and executed but which detected a bug.
- Number of blocked test cases: Number of test cases built, reviewed, but that cannot be executed for a technical or project reason.
- Total test design time: This is the total time it took to design and write the test cases.
- Total test reviewed time: This is the total time it takes before playing the tests, it is always relevant to have them validated by peers (whether for developers or testers).
- Total test design time: This is based on the estimates made during the change preparation phases for all the test cases planned for each campaign.
- Total test execution time: It represents the actual test execution time.
- Number of defects found: This represents the total number of defects found by the tester.
- Number of accepted defects: Here, it concerns the defects previously found and validated or not by the developers or the project managers.
- Number of rejected defects: This is the delta between the faults detected and those which are validated.
- Number of deferred defects: These feed the backlog of defects that will not be corrected during the iteration phase (whether by priority, by criticality or for a strategic reason).
- Number of critical defects: This one allows you to measure the quality of the change because it highlights the number of critical bugs.
- Number of resolved defects: The latter makes it possible to quantify the number of defects resolved during the iteration phase. The defects created vs. Resolved chart shows the rate of defect fixing. This grabs the team’s attention if this rate is slower than the rate desired.
- Total default resolution time: This allows you to measure the cost of bugs and their resolution.
- Total default review time: A resolved defect being tested, there is an additional time and an impact on the velocity of the team which can be measured thanks to this indicator.
- Number of defects found after delivery: Finding a bug in production is relatively critical, this indicator will be a good measure. The lower it is, the higher the retention rate.
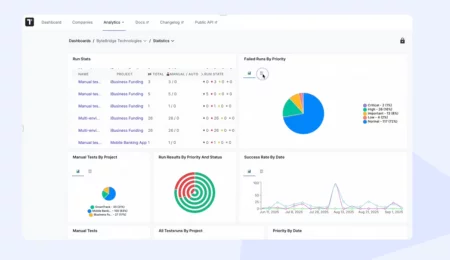
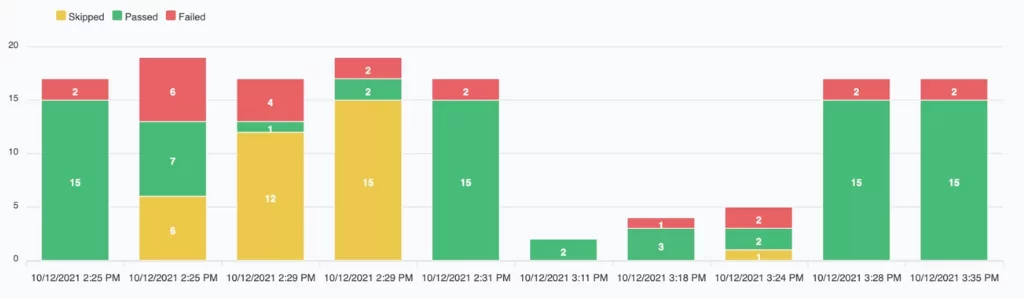
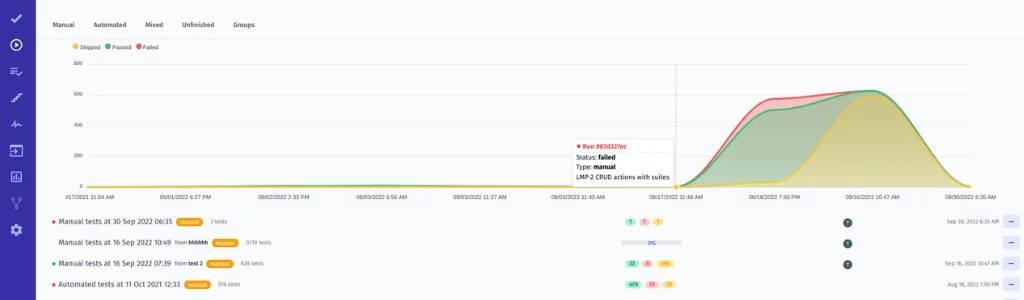
Mostly we visualize indicators through tables and line charts. See a few examples below:

Note: Indicators do not measure the quality of your applications. Absolute numbers are a great starting point, but typically indicators are not enough alone. Only KPIs are reliable and relevant elements to address this issue.
Typically QAs make calculations of Software Test Metrics with XLSX tables. Below are represented indicators prepared for it.
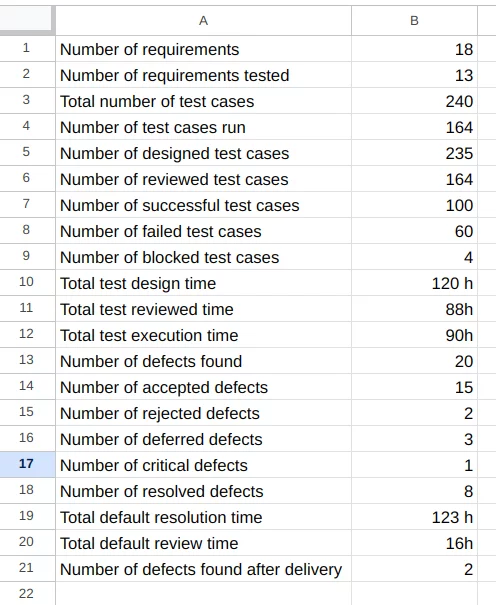
The value of each indicator depends on the project SDLC phase in which results are outputted.
At the same time is critical to determine for your testing:
- the project needs
- the goal for software testing metrics
- the appropriate testing metrics
- the target consumers of metrics
Taking these ones into account, here is a non-exhaustive list of the different KPIs that you can put in place:
→ Monitoring and test efficiency
→ Test effort per campaign
→ Test coverage
→ Cost of testing
Let’s explain these test software testing metrics 👇
Monitoring and test efficiency metrics
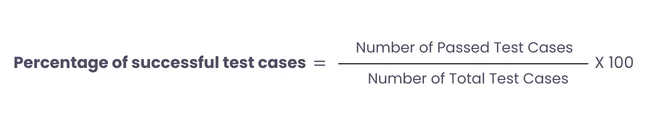
Business Objective: Obtain the Pass share of the executed test cases to evaluate quality in general.
The percentage of successful test cases provides an indication of how well a software product performs against its desired outcomes. The higher indicator, the higher quality. This metric, in turn, can be used to compare different App versions.
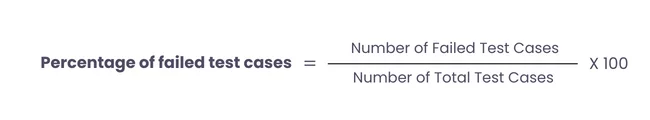
Business Objective: It is a strong indicator of the product bug rate.
The percentage of failed test cases metric helps identify the software’s readiness for delivery. A high ratio indicates critical issues of quality. If you have a ~ 50% failure rate, it shows terrible requirements definition. Vise versa low bug rate is essential for businesses to ensure customer satisfaction and maximize profits.
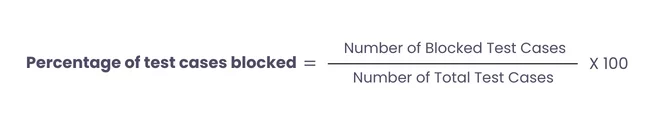
Business Objective: Indicates how developed software features work properly.
It is a metric used to measure the percentage of test cases that can not be executed because of some impediment such as missing prerequisites, unavailability of the test environment, unavailability of required test data, or a defect in the system under test.
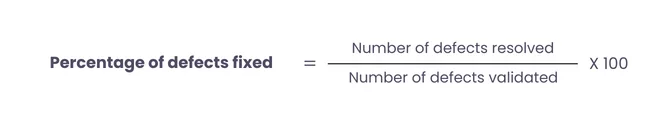
Business Objective: Ensure the overall quality control of the development process.
This metric is used to measure the effectiveness of a software development team in resolving defects found during testing. A low fixed defects percentage indicates the possibility of delays in project delivery.
Note: Fixed defects percentage is often used in conjunction with other software development metrics, such as defect density and defect backlog, to provide a more comprehensive view of the development process and to identify areas for improvement.
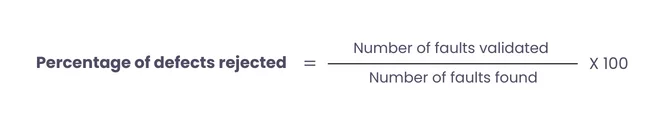
Business Objective: Represent the robustness of the defect management process.
A high Percentage of Defects Rejected indicates that team has a robust defect management process and is successful in detecting and fixing defects early in the development cycle, reducing the risk of defects escaping to production. A low PDR indicates that the team needs to improve their testing practices.
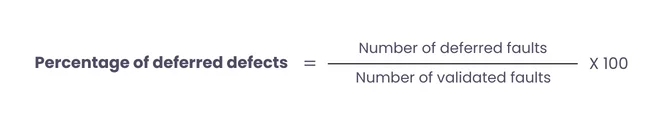
Business Objective: This metric helps understand the effectiveness of QA management processes as well.
The percentage of deferred defects identifies defects that were deferred within a particular time frame, sprint or release cycle. A high percentage of deferred defects may indicate a need for improvements in the development or testing process, or a lack of resources to address all identified issues within a given timeframe.
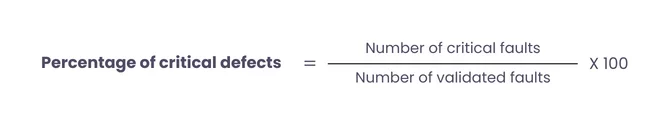
Business Objective: Measure the severity of defects found during software testing
Because this metric is useful for reducing the number of critical defects before the software is released to production.
Business Objective: Measure the average time it takes to resolve reported bugs or issues.
A high average bug resolution time may indicate that the team is struggling to fix bugs in a timely manner, which can lead to delays in software releases and potentially impact customer satisfaction.
It’s worth noting that this metric should not be the sole indicator of a development team’s performance. Other software test metrics, such as the number of bugs reported, the severity of bugs, and customer satisfaction ratings, should also be considered to gain a more comprehensive understanding of the team’s effectiveness.![]()
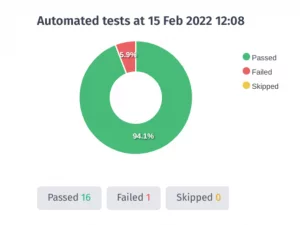
The percentage ratios are convenient to depict with the pie charts. An example is generated by Test Management System automatically.
Test effort per campaign
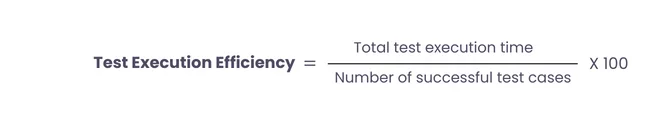
Business Objective: This test metric provides insight into how efficiently the testing process is being conducted, so helps optimize our testing time. Measuring the efficiency of the test case execution gives us a time frame of how much time is spent executing each test case.
The TEE (Test Execution Efficiency) metric includes any time spent waiting for resources, such as databases or network connections, to become available. A high TEE value indicates that the testing process is efficient, with minimal wasted time and effort, while a low TEE value may indicate inefficiencies that need to be addressed. For instance that there are too many test cases to execute, or the testing environment is not set up properly. Also, it can help prioritize test cases and allocate resources accordingly.
Also, TEE can be used as a metric to track progress over time. By comparing TEE from one testing cycle to another, teams can see whether improvements have been made and identify areas for further optimization.
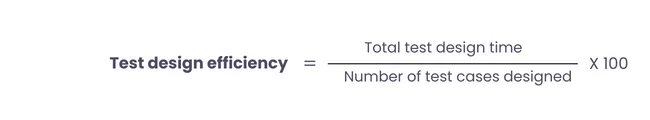
Business Objective: This metric provides insight into how much time is being spent on designing each individual test case.
Test design efficiency is useful to optimize resource allocation. By knowing how much time is required to design a single test case, you can better allocate resources to the test design process. For example, to set realistic expectations for stakeholders. If you know that it takes an average of 30 minutes to design a test case, you can plan accordingly and ensure that you have the necessary resources available to complete the work within the desired timeframe.
It can also be used to identify areas that may be slowing down the process for improvement in the test design process. By tracking the progress and performance of Test design efficiency over time, you can monitor progress and identify trends.
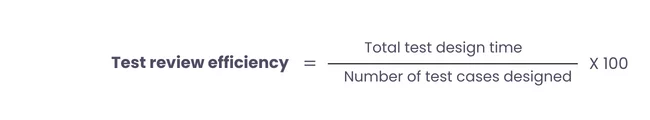
Business Objective: Test review efficiency refers to how efficiently a team or individual is able to review tests.
The test review efficiency metric can help teams identify areas where they can improve their testing process, such as streamlining review procedures or identifying bottlenecks that can be addressed more efficiently.
For example, you may discover that certain types of tests take longer to review, allowing you to adjust your testing procedures accordingly and reduce overall testing time.
Also, measuring test review efficiency can help QA managers allocate resources more effectively. By understanding how much time is required for test review, managers can determine how many resources (i.e., people, time, and money) are needed to complete the testing process to meet deadlines.
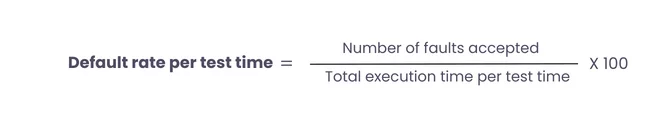
Business Objective: The default rate per test time evaluates the overall efficiency of a testing process, as it provides insight into the number of defects detected within a specific time frame.
The numerator of this formula represents the number of defects or faults detected during the test period, while the denominator represents the total time taken to execute the tests.
It is important to note that this metric should be used in conjunction with other testing metrics, such as defect density or test coverage, to get a more complete picture of how a testing process goes.

Business Objective: This metric provides an estimate of how many defects were found on average per test case execution.
It is worth noting that the accuracy of this metric can be influenced by factors such as the quality of the test cases, the complexity of the software under test, and the expertise of the testing team. Therefore, it’s important to interpret the results in the context of the specific testing environment and to use this metric in conjunction with other test metrics to get a comprehensive understanding of the effectiveness of the testing process.
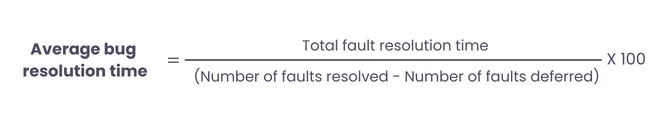
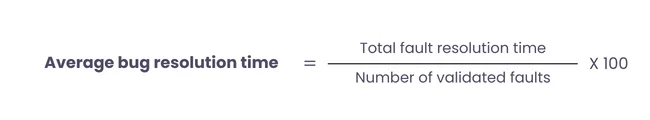
Business Objective: The Average bug resolution time is a test metric that measures the average time taken to resolve a software bug or defect from the time it was identified until it was successfully fixed.
Here, the total fault resolution time is the sum of the time taken to fix each bug, and the number of faults resolved is the total number of bugs that were fixed during the testing process. The number of faults deferred is the total number of bugs that were not fixed during testing but were instead deferred to a later stage.
By calculating the average bug resolution time, testing teams can monitor their bug-fixing progress. This can help them optimize their processes, allocate resources more effectively, and improve efficiency. A lower average bug resolution time indicates that bugs are being fixed quickly, which can help improve software quality and reduce the overall testing time. On the other hand, a high average bug resolution time that is taking longer than expected can indicate problems in the software development process or the need for additional resources or expertise. If the average time to fix a bug is increasing over time, it may indicate that the testing process is becoming less efficient or that the software is becoming more complex and difficult to test.
The average bug resolution time can also be used to set expectations with stakeholders, such as project managers or customers. Providing an estimate of how long it will take to fix bugs, it helps manage expectations and ensure that stakeholders are aware of the time and resources required to resolve issues.
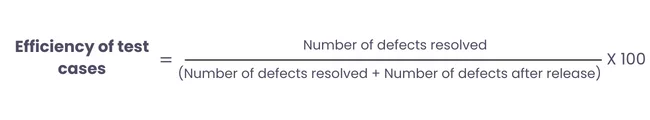
Business Objective: This test metric determines the overall quality of the software product.
This formula calculates the percentage of defects that were identified and resolved during the testing process, compared to the total number of defects that were found, including those that were discovered after the software was released to users.
The higher the percentage of resolved defects, the more efficient the testing process is in identifying and resolving defects before the software will release. This means that the software is more likely to meet the requirements of the stakeholders, have fewer bugs, and be more reliable. On the other hand, if the percentage of resolved defects is low, it indicates that the testing process may not have been thorough enough or that there were issues with the software development process, which may have led to a higher number of defects being found after release.
You may also want to read
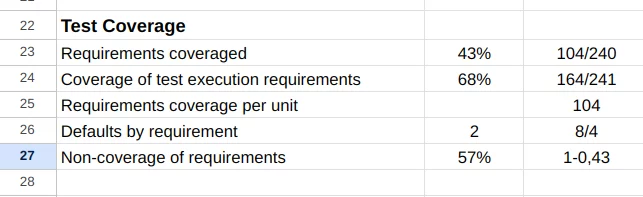
Test coverage
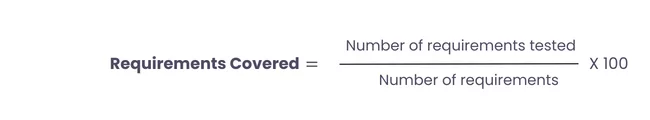
Business Objective: Requirements coverage should complete 100% by tests
With the assistance of this key performance indicator, the team can track the percentage of requirements covered by at least one test case. This metric helps evaluate the functional coverage of test case design. The QA manager monitors this KPI and specifies what should be done when requirements cannot be mapped to a test case.
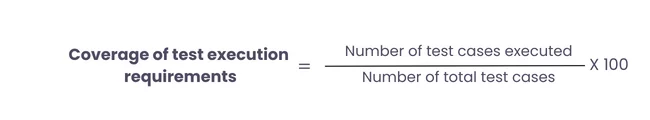
Business Objective: Show what the software product’s functionality is validated.
It helps us get an idea about the total number of test cases executed as well as the number of test cases left pending. Everyday test manager monitors this KPI to ensure the main program functionality coverage.
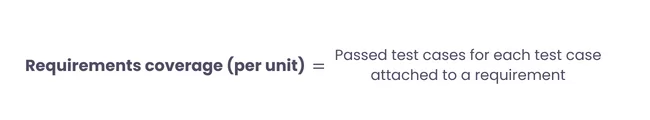
Business Objective: Shows the readiness of the product to release
If a critical requirement has yet to pass testing, the release should be delayed.

Business Objective: Controls that we do not miss anything important
This KPI is to make sure that any functionality that the testing will not be missed by the QAs team.
Cost of testing
Estimated cost Test: Estimated total test execution time + Total test execution time (expressed in hours) x Hourly cost of a tester.
Business Objective: The threshold testing cost.
Software quality assurance can be quite expensive. Provide a good return on your investment.
Average cost of testing per requirement: Estimated cost Test / Number of requirements tested.
Business Objective: Controls that we do not miss anything important
This KPI is to make sure that any functionality that the testing will not be missed by the QAs team.
Actual campaign test cost: Estimated Total Test Execution Time + Total Test Execution Time +total replay time (expressed in hours)x Hourly cost of a tester
Business Objective: Controls that we do not miss anything important
This KPI is to make sure that any functionality that the testing will not be missed by the QAs team.
Total campaign cost: Actual campaign test cost + (Total defect resolution time x Hourly cost of a developer)
Business Objective: Сontrol of testing сosts
Our budget should match testing costs. And one of the main manager’s tasks is to track it.
Cost Hourly difference: Total campaign cost – Estimated cost Test
Business Objective: Controls that we do not miss anything important
This KPI is to make sure that any functionality that the testing will not be missed by the QAs team.
Cost of bugs: (Total defect resolution time x Hourly cost of a dev) + (total replay time x Hourly cost of a tester)
Business Objective: This is calculated by the dollar amount of effort spent on a defect.
This KPI is to make sure that any functionality that the testing will not be missed by the QAs team.
Wrap-up
This material describes the basic metrics and showcases how you can transform them for valuable insights.
Overall, analyzing your current system by using software testing metrics can help you understand how much your testing strategy and processes are optimized and which areas need improvement. As a result, you’ll be able to make wise decisions for the next phase of the development process.
On the other hand, software testing quality metrics are a funny thing. They can be used for good or warped for bad. Therefore it is very important to focus on the software testing metrics themselves and separate the discussion of what the test metrics might mean. Because there is a risk to paint an artificially pretty picture. Be forthcoming in the information and help stakeholders through the repercussions and make the necessary changes. It is essential for improving the efficiency and cost-effectiveness of your testing.
I also know that if the assessment isn’t automatized and available to the QA managers under easy-to-read reports, it might become an intimidating process that gets constantly postponed.
But there is a way out, test management systems and test automation software are used to execute tests in automated testing and calculate test metrics automatically. And it is the contribution to optimizing QA processes as well.