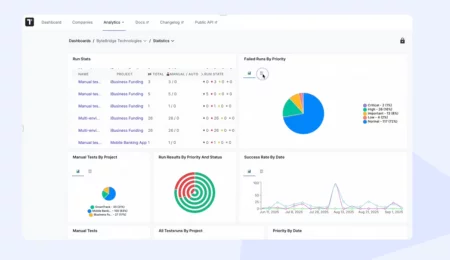
Test Management system testomat.io gets the data from executed tests and visualizes them in test results. Qualitative analytics toolset includes test automation metrics, manual test metrics, statistics, also pictures of heat mapping, progress bars, live charts, pie charts etc. These kinds of analytics representation allow competently managing workflows within an Agile team for all your company’s projects.
Keep in mind that our testing analytics are available on two-layer levels and might be efficiently used by different desision makers.
- Project level
- Global level (Aggregated Analytics Across All Projects)
Value of aggregated analytics for QA team
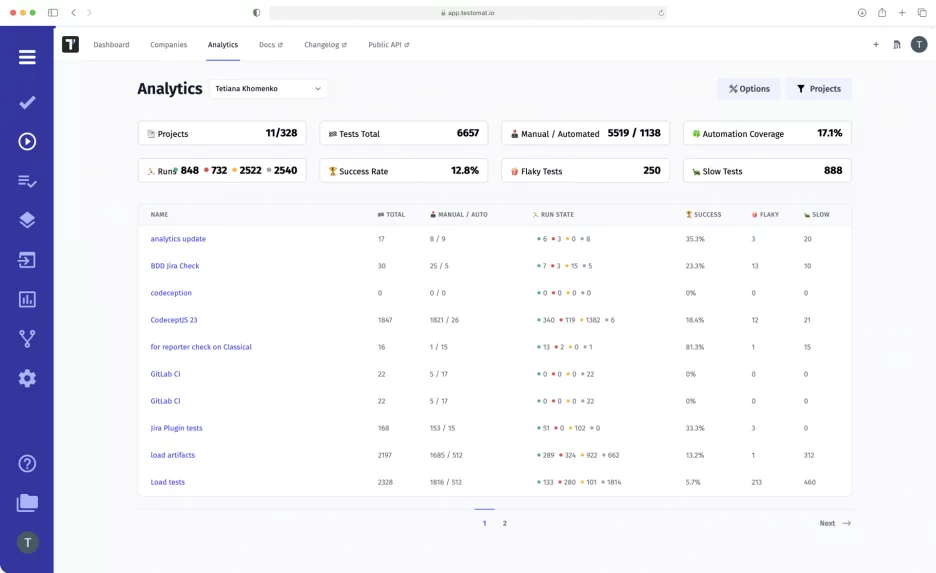
Aggregated data are displayed on the board in real-time in a visually friendly Analytics Dashboard. The QA tester can select any number of projects, filter them, and analyze them by key test metrics with access to aggregated analytics. Follow the link to find out team permissions and how to grant access.
The function is especially useful for an Agile QA team that works with a large-scale project divided into subprojects. Thanks to assembled test analytics, QA Lead can see how successful tests are in each area and find weaknesses requiring developers’ attention.
Another scenario is if the QA team is working on several projects simultaneously. Combined test data allows QA Manager to select only those that need to be analyzed at the moment or view the full list from an aerial view.
Based on aggregated metrics for each of them, the stakeholders can conclude the need to optimize a particular process within STLC(Software testing life cycle).
How to use aggregated analytics
The analytics is curated and delivered to you in relevant views based on certain pre-existing criteria. Input data is based on test execution data. So, to track analytics, all you need – just filter and check information through desired parameters on Analytics Dashboard.
Our solution offers a number of possibilities:
- choose all or specific projects
- filtering by various parameters
- sort tests by criteria
- visualization of indicators by projects
Thus, aggregated analytics supports searching through the list of projects your team is working with. By going to the project list, you can select only those that require attention right now or browse the entire list. And specify filter parameters in order to improve the accuracy of your search results.
By default options are used to sort the tests in the table:
- Test total: a total of all tests in the selected projects
- Run State: Success, Fail, Skipped, and not yet executed tests
- Automation Coverage: ratio of automated tests to all tests
- Success rate: the amount of success for all projects
- Slow tests: duration of the autotest (in seconds)
- Flaky tests: tests with changing status (passed, failed)
Additional options to the types of search filters:
- Company: select your company, it is convenient if you are a manager of more than one.
- Date range: specify the timeline you need for the data representation.
- Test environment: filtering by OS (Windows, Linux, macOS, Android, etc.), browser, and other environments used. It is possible to select several environments at once, for example, Windows and Chrome.
- Tags: filtering by the designations you specified in the title of the test at the stage of its creation. For instance, this way, you can find projects with tests of a certain type: @manual, @smoke, @security.
- Jira issues: filtering by the different types of tasks in Jira. Here you can write your own queries to find tests related to specific tasks in Jira projects.
- Labels: labels help group tests, so using this filter, you can search and display only tests with specific labels.
What are Custom charts?
Custom charts give teams control of how testing data is presented. QA managers can tailor the Global Analytics data view to their unique needs, rather than relying on predefined metrics.
After applying all the selected filters and settings, you will get a list of tests matching them. Now you can analyze them based on a whole set of test metrics.
Note, the table displays manual and autotests, taking into account the parameterized tests, i.e., those where some variable was changed. You can see the number of such tests by hovering over the cursor.
What are Custom widgets?
Customisable widgets for Global Analytics enable you to select the widgets that best reflect your testing objectives, allowing you to view the most relevant information at a glance. So, you won’t get lost in the sea of data, as evaluating the health of your testing activities is easier now, moving beyond one-size-fits-all reporting. Simply navigate to Dashboard → Analytics → Dashboards → Create Your Own Dashboard and choose from various metrics such as Success Rate by Date, Run Statistics, Automation Coverage, and Execution Trends.
The benefit of these Custom dashboards is that they enable data-driven decisions across the organization and its dependent testing projects, helping recognize patterns, detect bottlenecks, and track improvements over time.
What Metrics Are Used To Analyze Projects
- Run State – metric is displayed in a table and shows the results for the last test runs by passed, failed, skipped, and not executed tests. Even if there have been many runs in the project, you can track only the actual runs.
- Flaky tests – it is the number of unstable tests. Most often, these are automated tests, but testomat.io collects information from manual runs as well. Metrics help identify weaknesses in software that require optimization on the part of developers.
- Slow tests – the number of autotests with long execution. The framework sends information to testomat.io about how long each test was executed. A duration of 1,000 seconds or more can indicate technical problems in the project, for example, incorrect operation of a function on a website.
- Test Automation Coverage – as you run automation, you can get instant feedback on progress. This allows you to analyze how many tests have been automated in a particular part of the project compared to manual testing and prioritize them.
The global analytics are interconnected within each test project analytics as well. That is, similar indicators and metrics are displayed at the so-called micro and macro level, only the scale differs.
Also, you have access to comprehensive analytical information about:
- Defects – on the Defects Dashboard, you may see the list of defects per period of time
- Ever-failing tests – metrics display tests that aren’t fixed for a long time
- Never run tests – metrics measure the scope of imported but unexecuted tests
- Defect coverage – detailed statistics regarding Jira User Story.
Test management Saas tool testomat.io has an elaborate analytics ecosystem. Test result analytics are built-in in other test management functionality or work them closely.
Look briefly at the set of related test analytics functionality:
- Test Automation Integrations – the solution supports many popular testing frameworks: Cucumber, CodeceptJS, Codeception, Playwright, Webdriber.io, Cypress.io + BDD, Mocha, Cypress.io, Chai, TestCafe, Protractor, Jasmine, Jest.
- Real-time Reporting – the test report is available at least one test is completed. Your team does not have to wait for all tests to be completed, which is especially important for large-scale projects. The information is provided in real-time.
- CI\CD Integrations – our test management tool offers extensive CI/CD capabilities so that you can provide software to end users as quickly as possible. The solution supports seamless integrations with the top CI/CD tools: GitHub, GitLab, Jenkins, Bamboo, and CircleCI. This allows you to run tests continuously and track them in real-time.
- Team Management – means, that you can not only analyze projects but also manage them flexibly. Invite employees to test projects, give them access to analytics features, assign test performers, and track the entire team’s progress.