The test management system testomat.io represents test statistics by User Story. You can see information about all the tests related to a particular requirement, in other words, User Story, including their status as passed, failed, or skipped.
Test management integration with Jira
The Jira Statistics Widget works thanks to the Jira Plugin. It allows you to link tests to User Stories in the context in which statistical data are presented. Jira integration is bidirectional – you can work with Jira Issues from the test management system or close problems with an app in Jira, and all changes made are displayed in the test management tool. The Jira Statistics Widget helps with test management for Jira to do improvements.
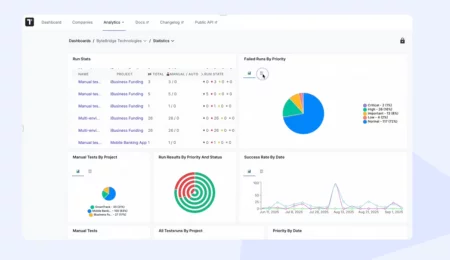
Test Analytics integration with Jira
On the other hand, Jira Statistics Widget is part of the metrics ecosystem of the test management Analytics Dashboard. You can track defects, check test automation coverage, requirements traceability, and flaky and slowest tests on the platform. We place so much importance on developing analytics because it is important for every team member: testers, automators, managers, business analysts, etc.
Why Jira Statistics Widget is Useful for Your Team
Atlassian Jira bug and requirement tracking tool is popular in many Agile teams, so they haven’t to spend time learning a new one. Moreover, Jira Statistics Widget improves their positive experience with their favourite tool even more.
The key advantage of this kind of Jira integration:
- widget is good because it visualizes the user story
- allow track User Story distribution from the top.
- Business Analyst(BA), Product Owner(PO) can see the test coverage of user stories
- QA manager and Automation test engineers are able to track Automation progress
All data is provided in real-time, and detailed analytics allow you to identify existing problems and start working on fixing them as quickly as possible. Timely receipt of systematized information on all running tests is the key to correcting errors early in the product lifecycle.
Note: If a project in testomat.io is linked with several Jira projects, the widget shows data for all Jira Issues. This is especially relevant for large companies, where teams are involved in testing different company products simultaneously.
How To Use Jira Statistics Widget
Our solution for collecting statistical data on tests run on Jira projects contains a few screens.
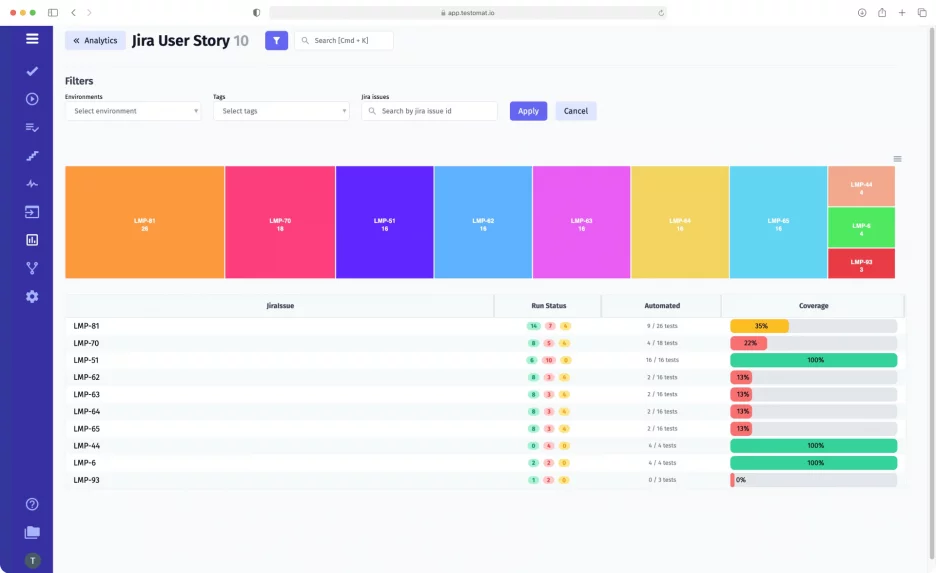
The central component of the Jira widget is Heat Map. It shows the visual correlation of Jira Issues and the number of tests, ranking them from more to less. We offer people the possibility to share the data in Jira via e-mail or in Microsoft Teams. To do this, simply download the Heat Map in one of the available formats.
Under Heat Map, you can see the following metrics:
- Jira Issues: this is a kind of access key to the Jira project management system;
- Run Status: shows how many tests were run, failed, or skipped per User Story;
- Automation Coverage: shows the percentage of automated tests in each User Story.
The data in each metric can be sorted by percentage of automation, the number of autotests, and a number of failed tests.
If you click one of the Heat Map or Jira Issue fields, a detailed overview of the test list for a particular User Story opens. The Jira Statistics Widget is very easy to use. One click is enough for our customers to search for the necessary information, and all the required data will be displayed on the screen. This is made possible by filters and the search bar.
It is possible to use filters to find the information you need:
- By testing environment: for example, you can choose to filter by a specific operating system (Windows, Linux, macOS, etc.). You can request data for several environments at once. The system will gather them into a single logical group and present them in a common report.
- By tags: @tags can be used to denote any functionality by writing them in the title when creating a test. The collected data are easier to filter while searching for the required functionality or a specific group of tests of the same purpose.
Search options of Jira Statistics Widget
Jira Statistics Widget supports searching by the name of a particular Jira Issue or a test. The latter provides the ability to see which Jira Issues a particular test is associated with and its status – passed or failed. Pay attention, the same test can be attached to different User Stories!
Associated Test Management functions
- Real-time Reporting – our test management tool supports real-time reporting, allowing you to get information about the total number of tests and see how many were passed, failed, or skipped before the end of testing.
- Mixed run from Jira Plugin – this feature allows you to run automated and manual tests simultaneously, track test execution status, and store all tests and reports in one place. Test result information is used for in-depth analytics and real-time reports available in the Jira Statistics Widget.
- CI\CD – you may run all or specific automated tests once CI\CD are configured in the test management dashboard menu from the test management system, moreover directly from the Jira Plugin. CI\CD integration pipeline works on GitLab, GitHub, Jenkins, Bamboo and CircleCI etc.
- BDD support – business is interested in understandable scenarios. Gherkin language with BDD approach are best suit to write test scenarios in such way.
- Link Automated tests in Jira – you can automate your test cases by assigning automated tests to them and send the test results to Jira.
- Requirement traceability report – allows check requirements, linked to tests.