Our team advocates the automated-first approach in test management. Above all, we care for the functionality helpful to Automation QA professionals involved in Agile SDLC. Thereof Stack trace and exception feature is one of the great strengths testomat.io test management solution.
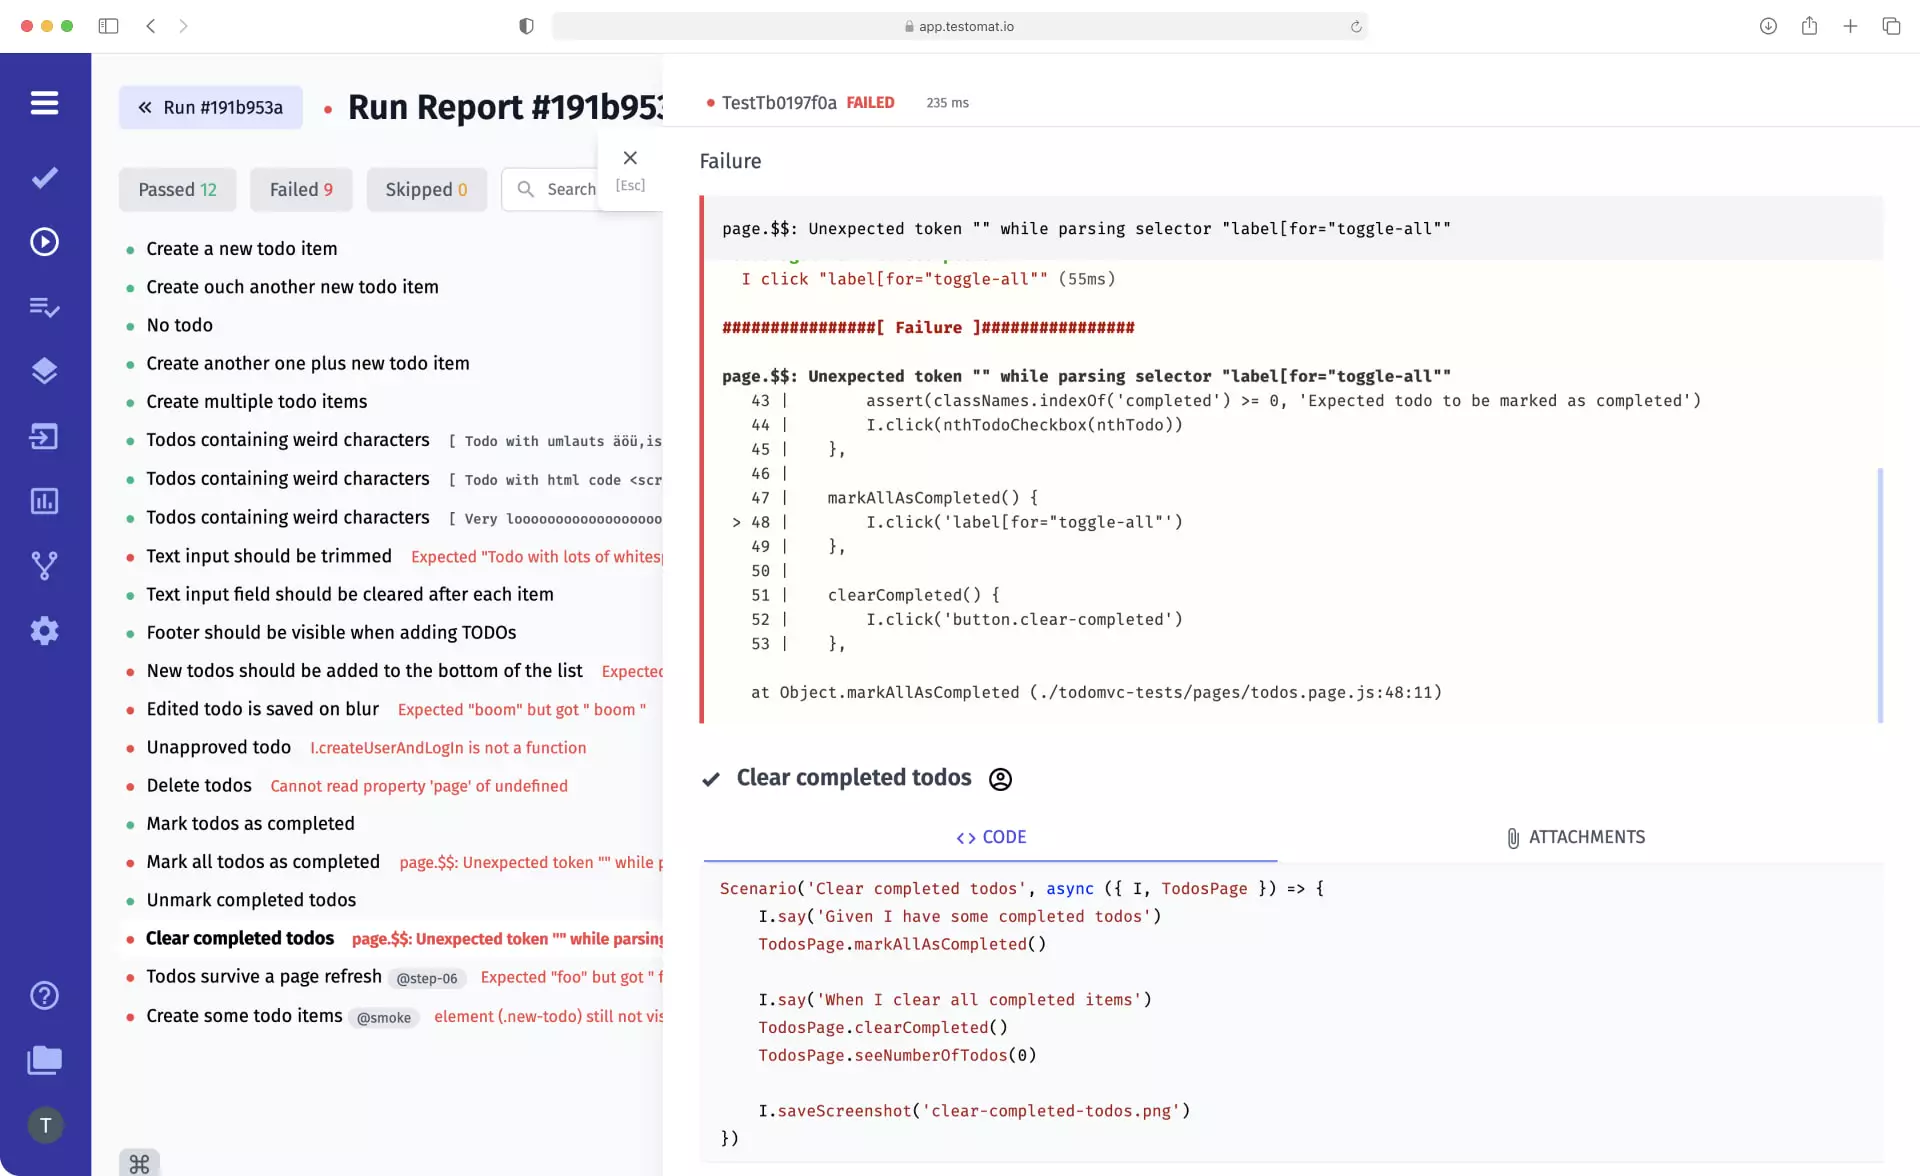
The following code example in the top picture displays an exception and then catches it and represents a stack trace to us in a such way that we can see an extract of code where this error happened. What does that code do? Where does the data used in that method come from?
Stack trace and exception is the method of obtaining additional information about test failures. Its root comes to debugging code. Let’s explain what they are and how they are made.
What is meant by stack traces?
Stack traces and exceptions are often associated with each other. Exception is an error in the program code. Error in the test is also an exception. Stack in an answer on this exception that return where it occured and what it caused. It tells us the details of the exception. A trace of the method calls is called a stack trace. That’s all.
This one can be a great help. Stack trace and exception message is a reason to start looking for the underlying problem in your test. Because it shows what code piece was running when that happened. The code might give an idea of what went wrong, but to discover what caused the exception, you should explore this code by context, it often makes sense. There is a lot of useful information. You can check first whether the error is caused by how our code uses it. Looking for your own errors in code is a useful skill for an Automation Quality Assurance engineer.
Log an exception in the stack trace
You do not need to look for your exception error in the framework logs. When things go wrong in your testing framework, you will have is lines printed on the screen that looks like the code below on a Failure tab of failed tests(marked by the red spot) in the test management system. You can see this menu by clicking on this one spot. This is a stack track.
You make sure reading the stack trace is easier immediately in the test management project then try to find errors in blind within the test framework code. And read stack trace message will let you home in on problems and makes debugging much less painful and quikly.
Set of functionality that works with stack traces and exceptions feature:
- Import automated tests – you can import any ready-made Unit, end-to-end, or API tests into test management, manage test runs and analyze their results. It is also possible to synchronize automated test cases with manual test cases in one place. All the Automation QA need to do is click Import automated test cases and, in the opened menu, select the desired testing environment and its type. After that, just copy and paste the ready to cmd from appeared tips.
- Unlimited history – with this feature, users can analyze why the test was passed and became failed through historical trends. If you make a new import and the test is passed, the stack trace will disappear, but you can check by comparing versions with history.
- Flaky test management – easily detected flaky tests! And with a flexible “flakiness” configuration decide which tests should be flaky yourself.
- CI\CD integration – provides the possibility to run all or specific automated tests once CI\CD are configured in the test management dashboard menu from the test management system, moreover directly from the Jira Plugin. CI\CD integration pipeline works on GitLab, GitHub, Jenkins, Bamboo and CircleCI etc.