

Undoubtedly, test reporting is considered a crucial element in software testing and helps QA and development teams make well-informed decisions. Since there is a wide range of reports aimed at meeting any testing needs, with Playwright Reports, dev and QA teams can get a detailed summary of test performance, making Playwright debugging more efficient and its test management smoother.
In the article below, you can find information about the importance of test automation reports, reveal various types of reports, and learn how to choose the most suitable ones. Also, you can discover what tips to follow to succeed in Playwright reporting, as we consider it the most popular testing framework today.
What is Playwright?
Developed by Microsoft, Playwright is an open-source framework which is used for browser automation and testing web applications. Thanks to its ability to test Chromium, Firefox, and WebKit with a single API, teams can apply it as an all-in-one solution when conducting real-time functional, API and performance testing. Also, teams can carry out end-to-end testing by simulating user interactions such as clicking, filling out forms, and navigation.
Explore more here:
Being compatible with Windows, Linux, and macOS, the Playwright tool can be integrated with major CI\CD servers such as Jenkins, CircleCI, Azure Pipeline, TravisCI, GitHub Actions, etc.
In addition to that, Playwright has broad language compatibility – supports TypeScript, JavaScript, Python, .NET, and Java – to provide QAs with more options for writing tests. In total, there is a list of key Playwright’s features:
- Cross-browser support – Chrome, Firefox, WebKit.
- Automatic waiting for elements to be ready.
- Parallel execution of tests to deliver high performance.
- Mobile device emulation and geolocation simulation.
- Easy integration with CI\CD tools.
Find more information about Playwright’s capabilities for automation testing:
What is a Test Report in Playwright?
A Playwright test report is a detailed document, which is generated after running a set of automated tests using the Playwright testing framework. It displays test results to reveal which tests were passed, failed, and skipped, and helps to uncover how well the application functions or performs.
In the Playwright test report, you can find the following components:
- Status of Tests. This component shows information about passed/failed/flaky/skipped tests.
- Error Details. This component outlines the types of errors (for example, assertion failed, timeout, network errors) and their positions within the application.
- Execution Time. Here you can discover how much time it took to run each test to uncover slow tests and performance issues.
- Screenshots. For a failed test, Playwright will automatically take a screenshot at the point of failure and provide crucial visual context.
- Videos. Playwright can record a video of the entire test execution for failed or all tests, providing dynamic information and showing what has led to a full-scale failure.
- Logs & Debug Information. Detailed logs that can help developers debug issues by providing insights into browser actions, network requests, and responses.
- Test Coverage. This component is valuable because it provides visibility into the number of tests within the coverage scope.
Indeed, Playwright reports have been designed to be interactive – with options of expanding/collapsing sections, filtering tests, and navigating through detailed failure information such as stack traces, screenshots, and videos with ease; and giving QA and dev teams an important understanding of the test’s performance in context.
Why teams need Test Automation Reports
- They see visual representations of the results of tests and can prioritize bug fixes and enhancements depending on how they affect the user experience.
- Teams are in the know about the full picture of how all the tests have been executed: they see the number of passed, failed, or skipped tests to understand how good and stable the application is.
- Thanks to reporting options, teams can get clear details of what went wrong to find and fix the main problem quickly.
- Teams can see how much of the app is being tested and which parts still need testing.
- Teams should not check the results of all tests manually to identify common problem areas in the app.
- With regular and detailed test reports, teams can monitor how well the app is doing in different tests to decide how to make their test automation better.
Different Types of Test Reporters in Playwright
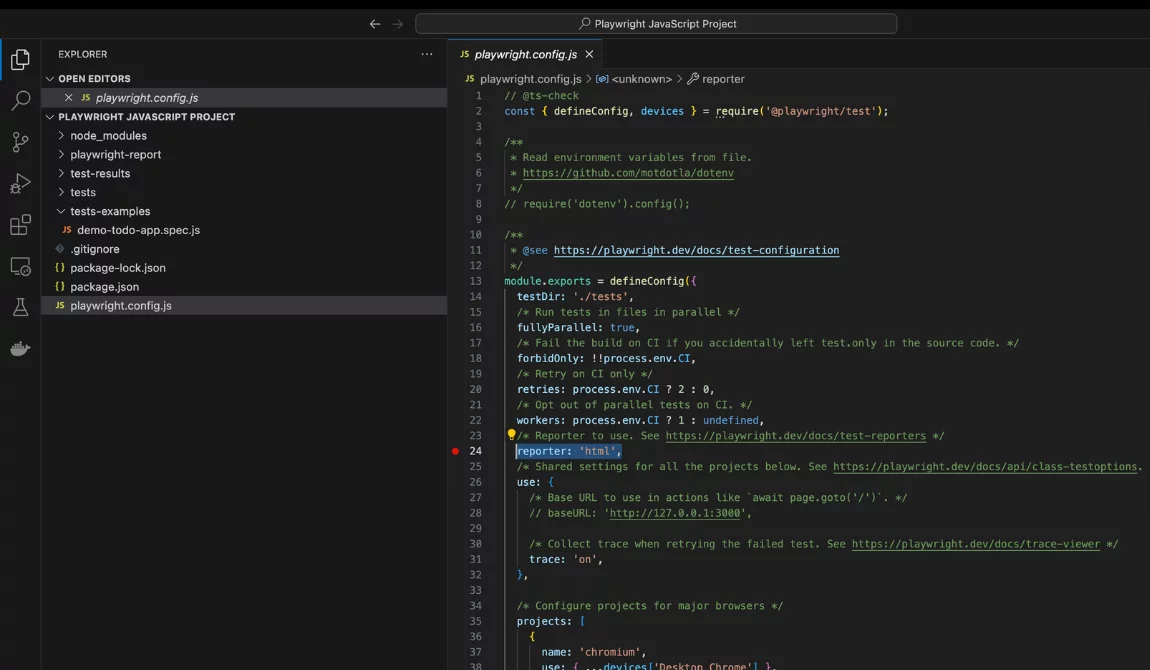
When you run Playwright tests without specifying a reporter, it uses the list reporter by default. For more control, it is good practice. Specify your preferred reporter you can in the file playwright.config By default, the HTML reporter is applied.
Additionally, the easiest way to build reporters is to pass the --reporter flag with the command line. Example Playwright HTML reperter:
npx playwright test --reporter=lineFind your test result reports you can in the root folder result-reports or other if you set it.
So, let’s review the Playwright reporting types and reporter methods you can utilize to meet your testing needs.
Built-In Playwright Reporters
List Reporter
Playwright’s List Reporter provides a compact and text-based summary of the tests run. For every test that encounters a problem, it delivers the error message right near it and a call stack – this helps in figuring out what has gone wrong. While it doesn’t offer interactive features like the HTML report, its simplicity makes it an excellent choice for rapid debugging during development.
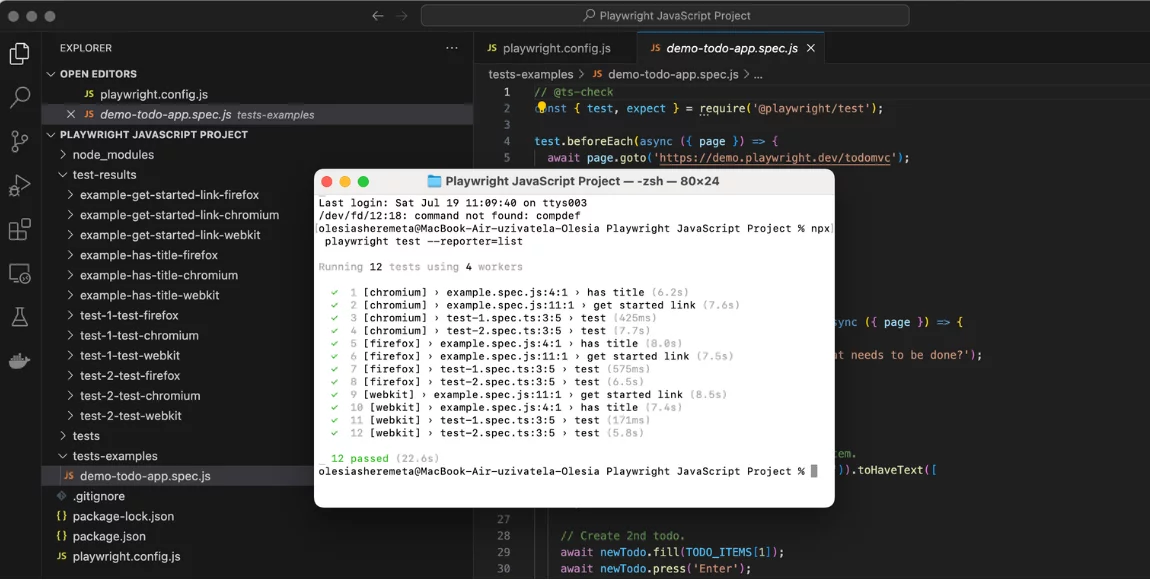
Furthermore, the List Report offers valuable information on test execution status, but without the need for a browser or complex UI. This reporter is useful for CI\CD pipelines where a simple, sequential output is preferred for logging and immediate feedback.
Line Reporter
Being a highly compact, line reporter uses a single line to display test execution results and dynamically update it as tests complete.
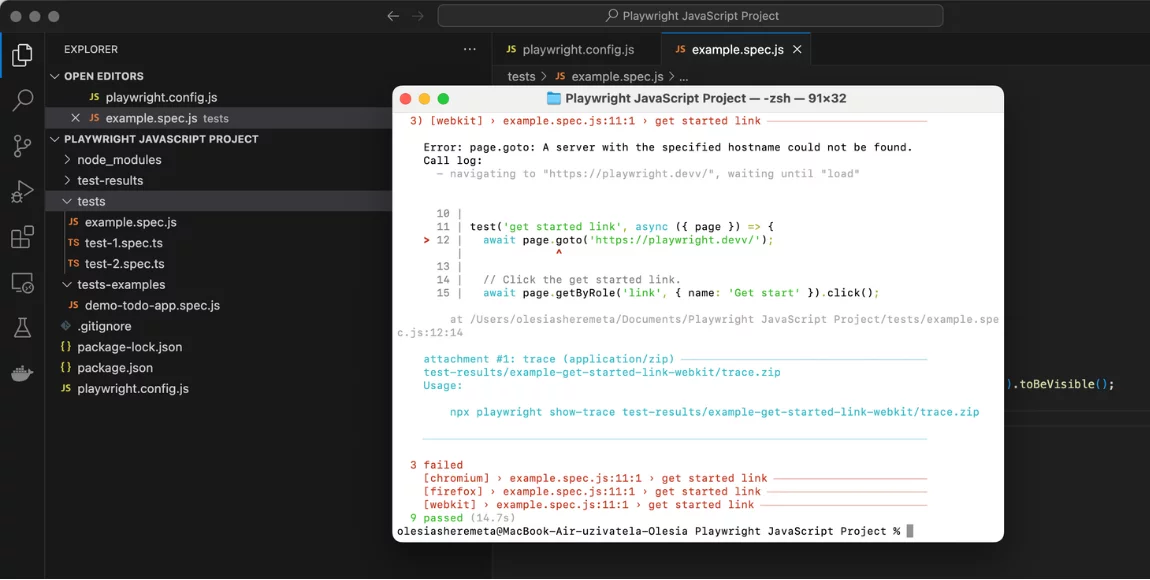
Line reporter is useful for large test suites, where it shows the progress but does not spam the output by listing all the tests.
🔴 It is important to mention: Line Reporter only outputs detailed information, such as error messages and stack traces, specifically when a test fails to make it very useful for developers who need quick feedback during local development or in CI environments where log details should be controlled. Overall, it prioritizes a clean console while still delivering immediate alerts for any issues.
Dot Reporter
When you run your tests in the console, Playwright’s Dot Reporter provides a highly visual representation. It uses a single dot (.) for every test that passes, so you can instantly see how things stand at any time as tests are run. If a test fails, it usually emits an ‘F’ (‘Failure’) or similar character as a warning.
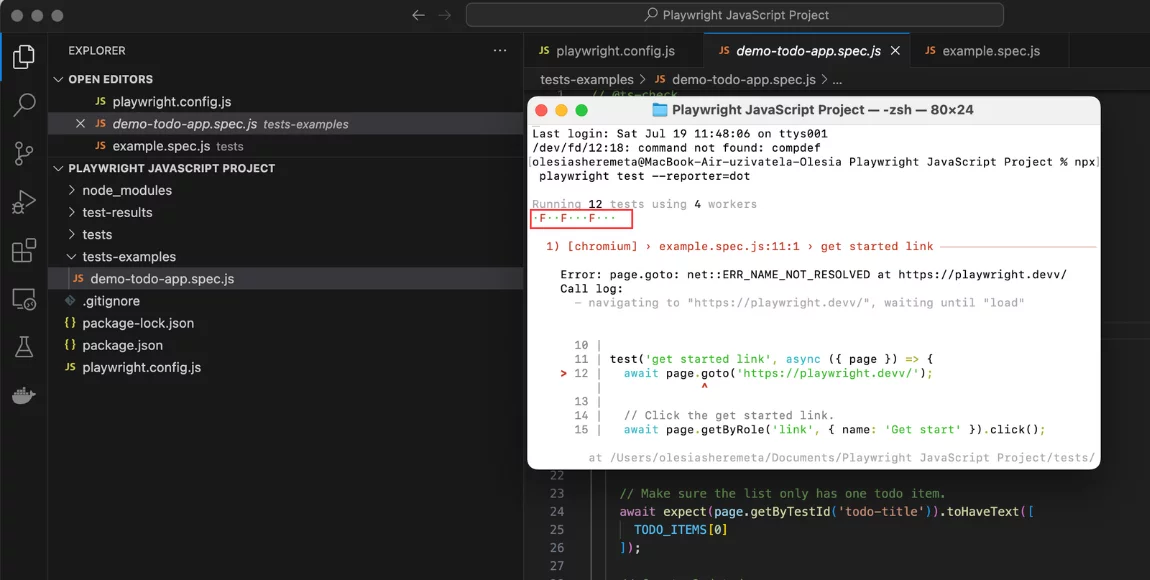
Dot reporter is a good fit if you need to quickly measure overall test suite results without detailed output, making it just right to use on large projects or in the CI\CD dashboards. Its main advantage is that it offers a real-time and intuitive visual progress for your test suite.
HTML Reporter
HTML Reporter is an invaluable tool, which is used by teams to visualize test results in an intuitive and interactive web interface. After a test run, it generates a comprehensive HTML file which can be opened directly in a web browser. In our cases index.html file:
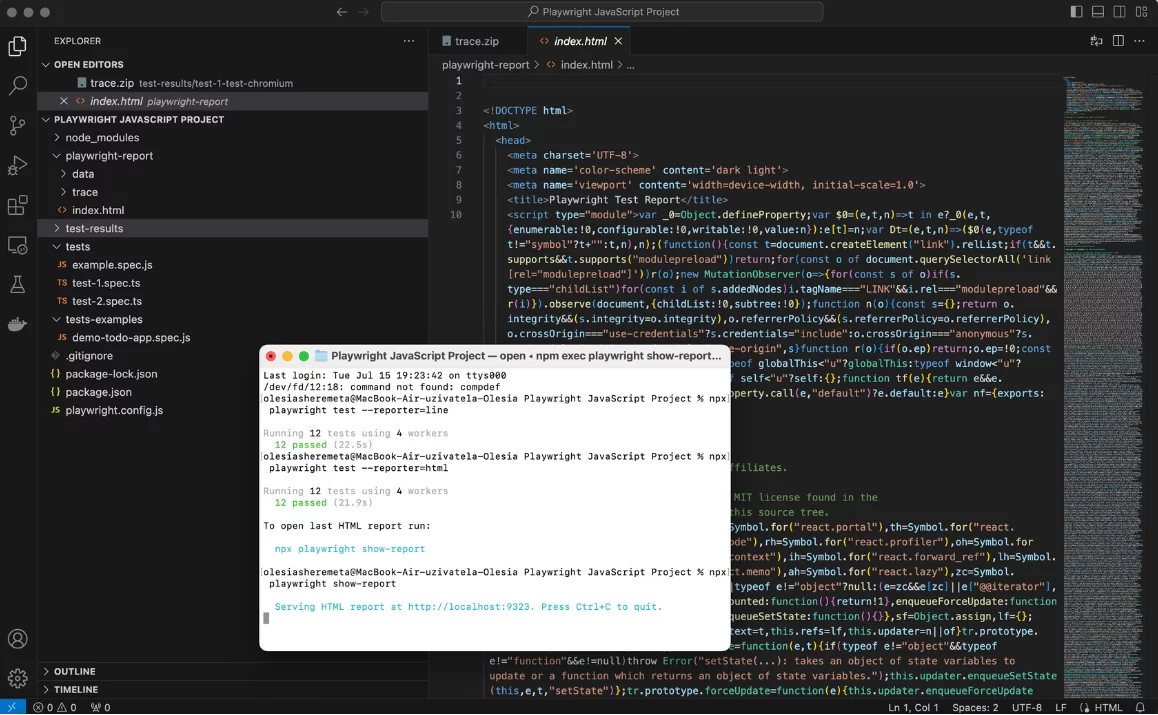
After we open the HTML file, we can see such a report in visualization Passed, Skipped or Failed tests:
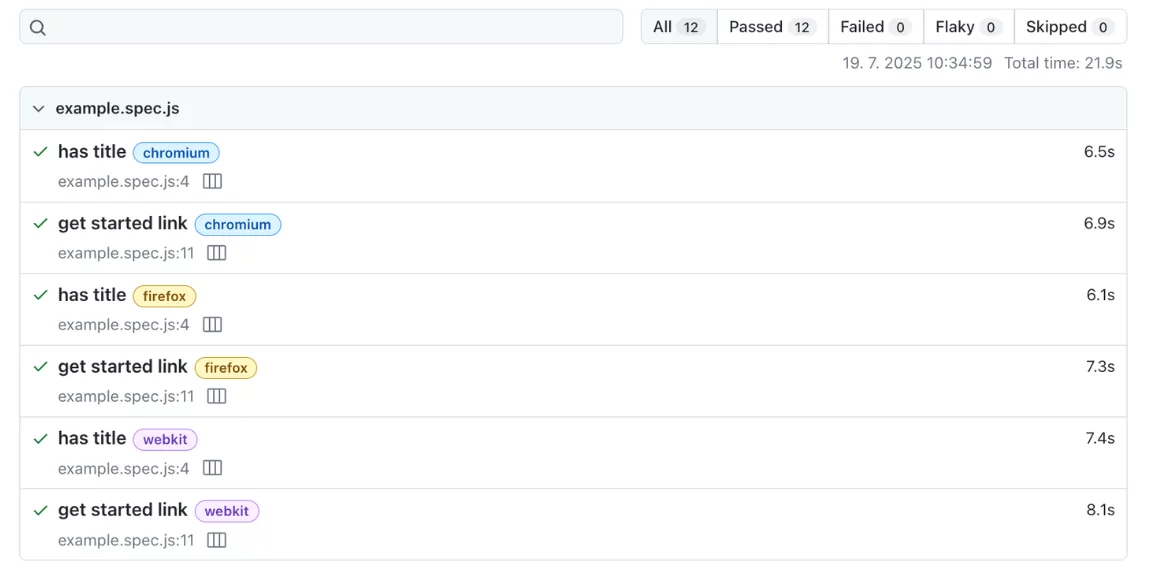
The playwright HTML report gives a detailed overview of all tests, clearly displays which areas of the application were tested, and highlights the status of each test and its coverage.
For any failures, it offers detailed accounts of failures, notes error types and locations, supplemented by screenshots, videos, and powerful trace files.
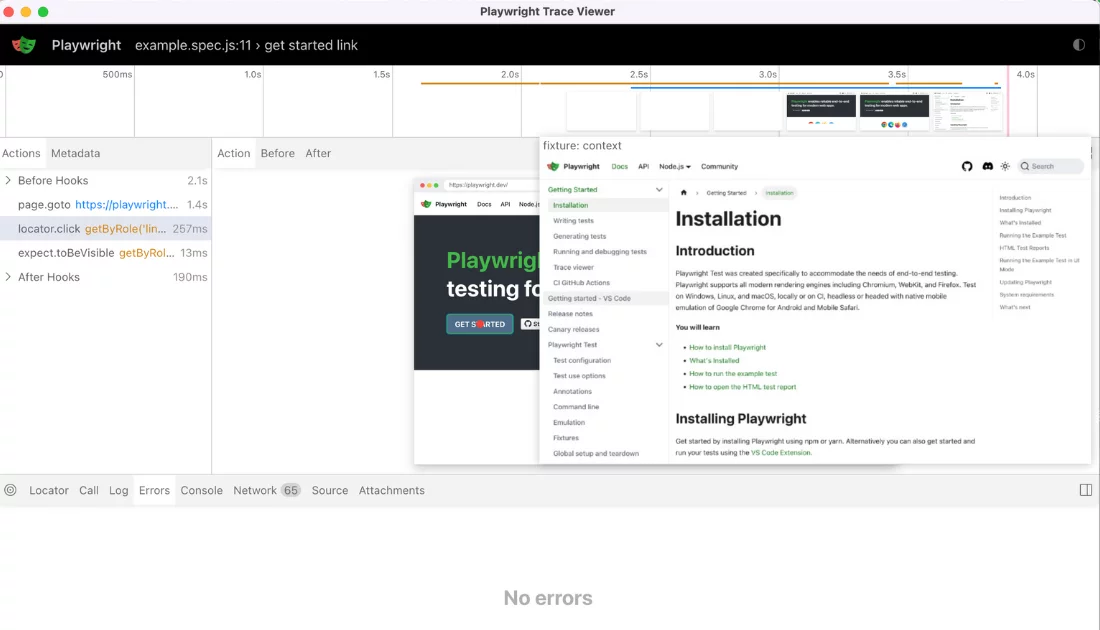
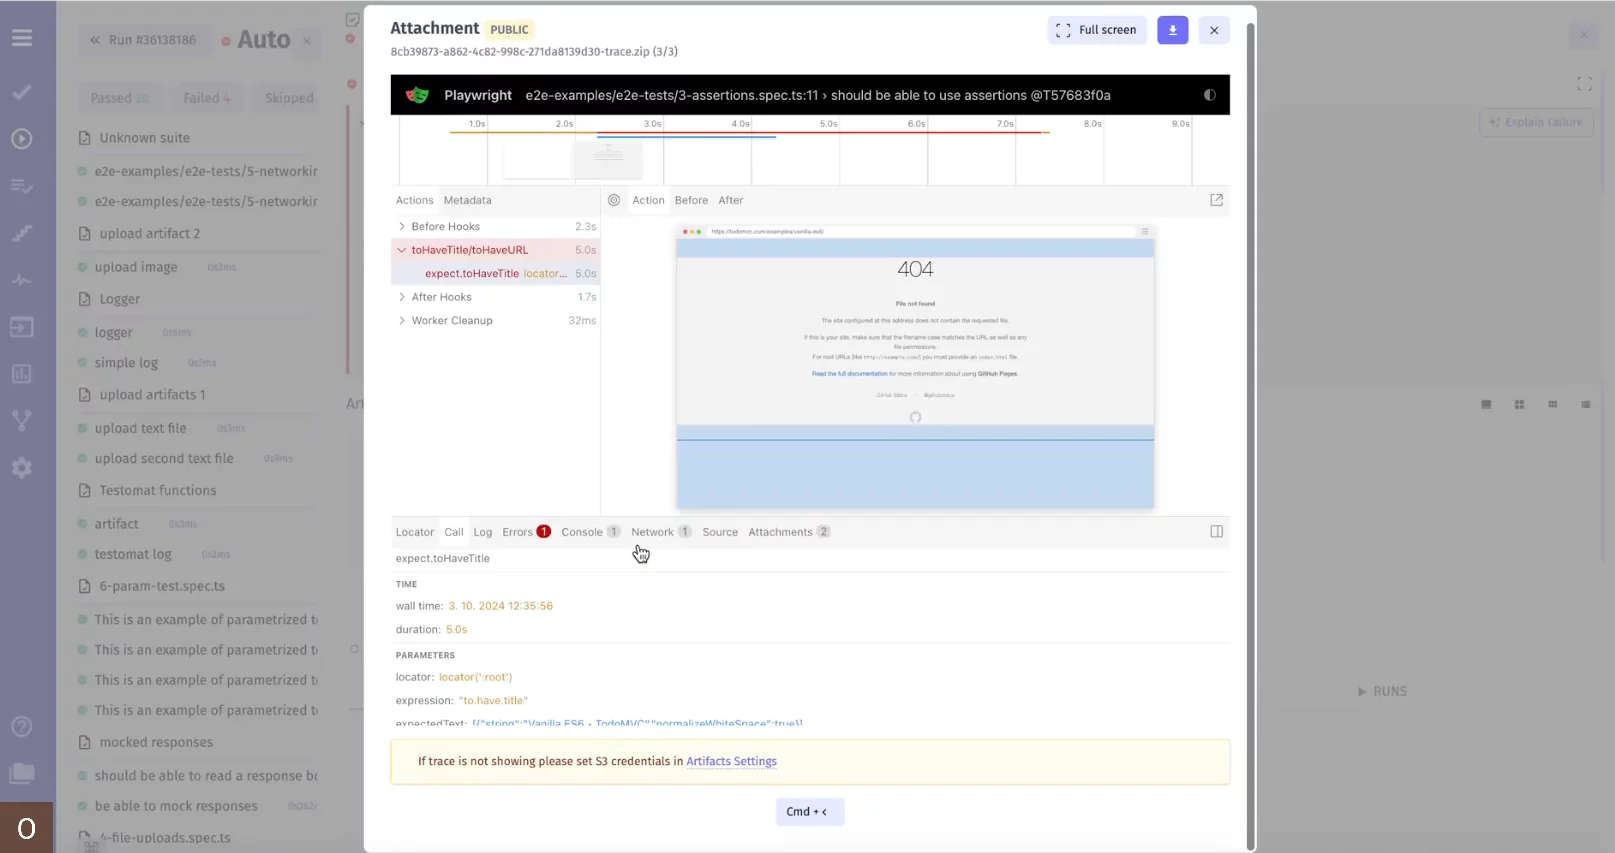
🛠️ What is Playwright Trace Viewer?
Playwright can record a trace of your test execution—essentially a detailed log that includes:
- Screenshots and DOM snapshots
- Network requests/responses
- Console logs
- Actions performed (clicks, inputs, navigations, etc.)
The Trace Viewer then lets you open these trace files in a visual UI for step-by-step playback. In Trace Viewer you can easily understand what exactly went wrong —maybe a timing issue, a missing element, or a slow response.
JUnit Reporter
Playwright’s JUnit Report is built to output test results in the standardized JUnit XML format that is crucial for Continuous Integration/Continuous Delivery (CI\CD) systems.
JUnit reporter produces a JUnit-style xml report.
Most likely you want to write the report to an xml file. You can see it on our screenshot in the down left corner. When running with --reporter=junit use the environment variable:
PLAYWRIGHT_JUNIT_OUTPUT_NAME=results.xml npx playwright test --reporter=junitIn configuration file, pass options directly:
import { defineConfig } from '@playwright/test';

export default defineConfig({
  reporter: [['json', { outputFile: 'results.json' }]],
});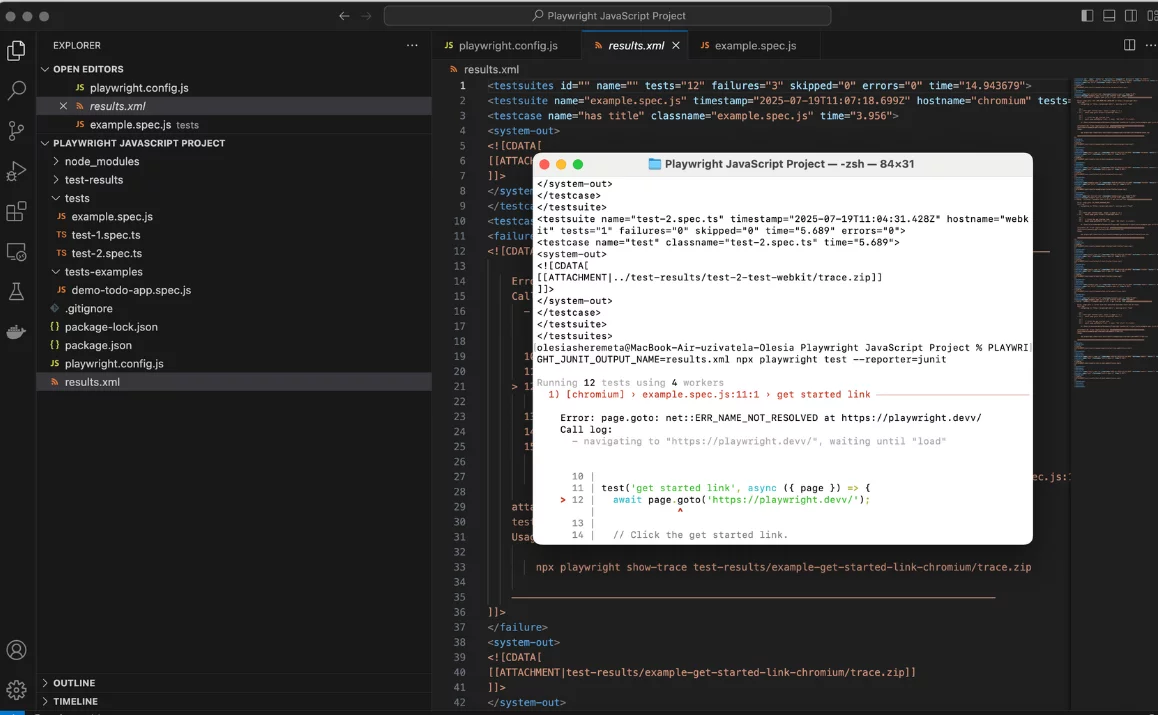
The generated XML file includes all the information about the test suite and cases – names, durations, and results. For failed tests, it provides essential details like error messages and stack traces, enabling automated parsing by CI tools. Its biggest advantage is that it can be used in any CI pipeline, with build servers readily able to understand the results of tests and processes controlling deployments. Although it does not provide the rich interaction of the HTML Reporter, its machine-readable format is essential to make automatic quality gates and continuous feedback work. You can download the XML JUnit Report file and upload it to various analytics tools to view data in a more refined presentation.
Multiple Reports in the Configuration File
With Playwright, you’re not restricted to a single report format, so you can meet a variety of requirements. Thanks to this adaptability in reporting, you can assign multiple reporters at once to the configuration file and define them on the console terminal. In the configuration file write:
  reporter: [
    ['html'],
    ['json', {  outputFile: 'test-results.json' }],
    ['junit', { outputFile: 'results.xml' }]
  ],
For instance, you can create a HTML report and a JSON report to receive a JSON file along with the results once you specify it in the command line or configuration file.
Custom Report
With Playwright Custom Reporter, you can tailor test result output based on the project’s unique needs. You can develop your custom reporter using JavaScript/TypeScript to transform raw test data into any format or integrate Playwright tests into existing workflows or proprietary systems that don’t support standard report formats. A custom reporter allows you to filter, aggregate, or visualize data and give a view of the results of tests, which can be reviewed by all relevant stakeholders.
For using the Custom reporter, you need to study more about the Reporter API and update the Playwright configuration file by writing its data there:
import { defineConfig } from '@playwright/test';

export default defineConfig({
  reporter: [['./my-awesome-reporter.ts', { customOption: 'some value' }]],
});
Third-Party Reporters in Playwright
Playwright allows you to integrate third-party reporters to extend its built-in reporting capabilities more extended. Thanks to these external tools Allure, Monocart, Tesults, ReportPortal, Currents, and Serenity/JS, teams can improve the reporting process by adding the following features – detailed HTML reports, real-time monitoring, and interactive dashboards; they also help teams in viewing test results and visualising them in different formats and simplify the monitoring of test performance, failures, and trends.
Max Schmitt, Open Source enthusiast, Playwright full-stack web developer, gathered all such third-party solutions for Playwright in a single GitHub repo, Awesome Playwright.
In this repo, we are also represented 😃
Playwright’s integration with testomat.io enables teams to see a live status before the test run has finished execution. And, a full report link will also be created to share among all parties involved as necessary.
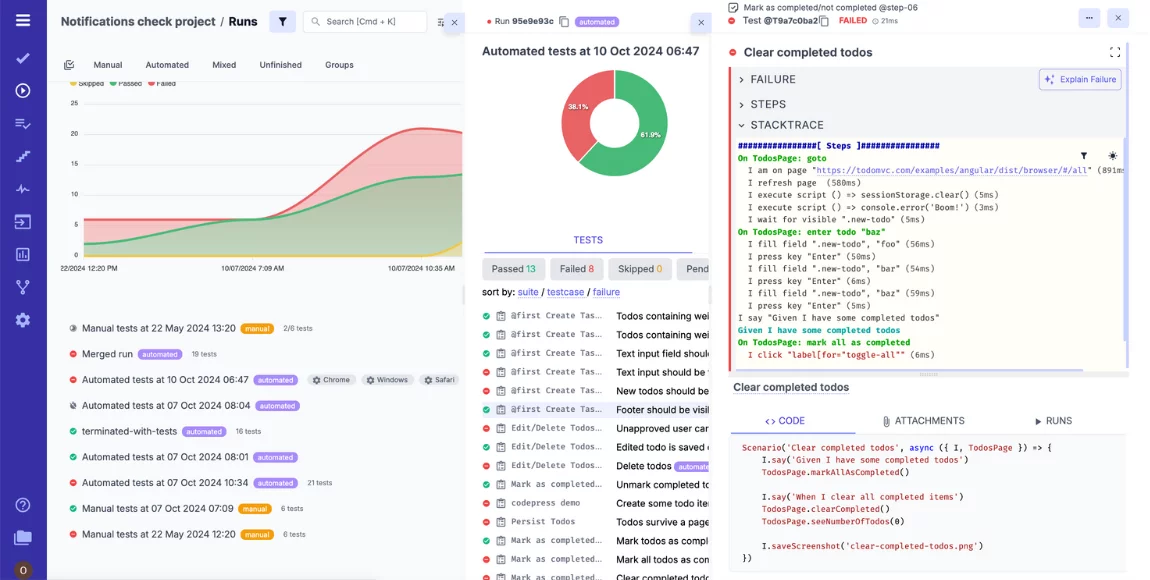
If something fails, the execution trace, test case, and attachments can be analysed to find out what went wrong.
These reports are good for analyzing whether build compile, automated test execution, or deployment steps passed or failed.
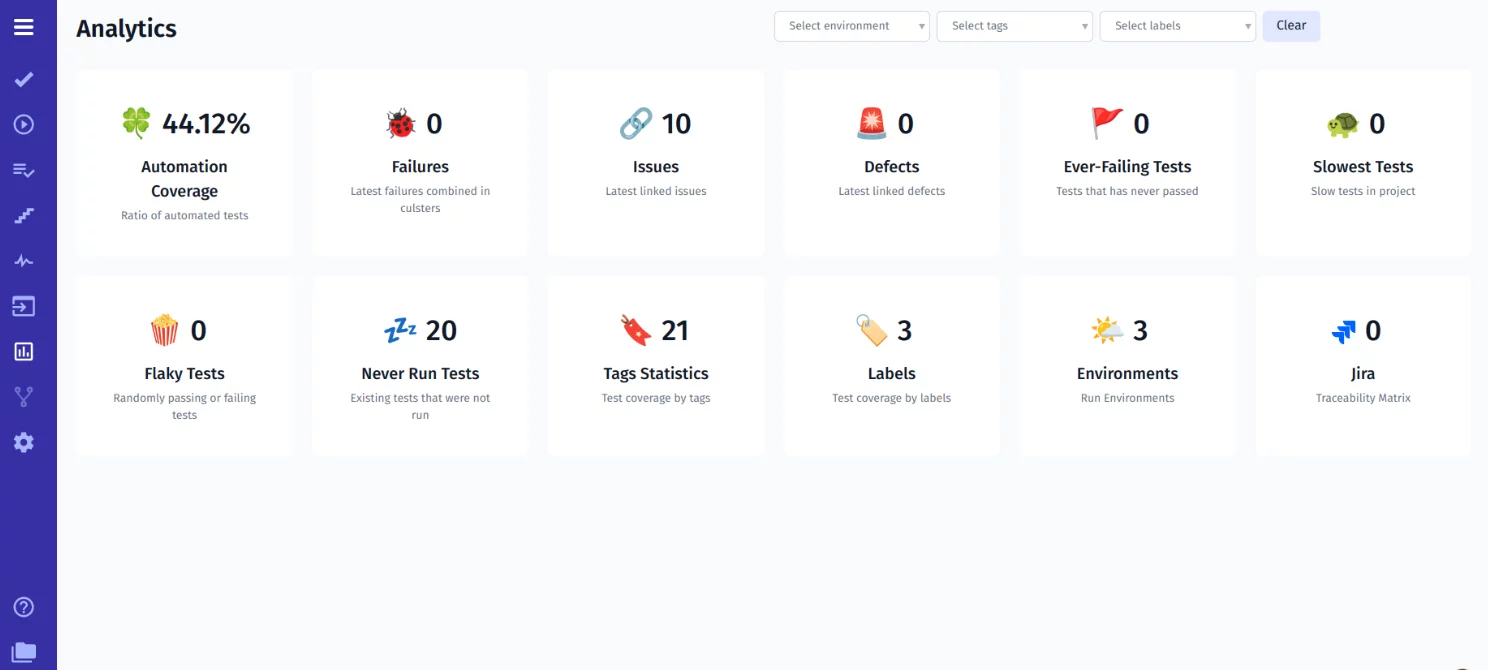
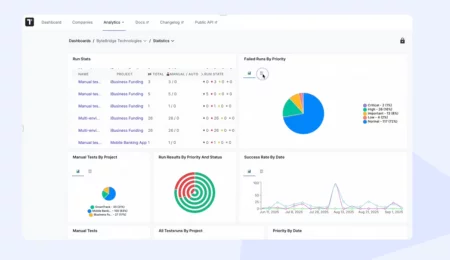
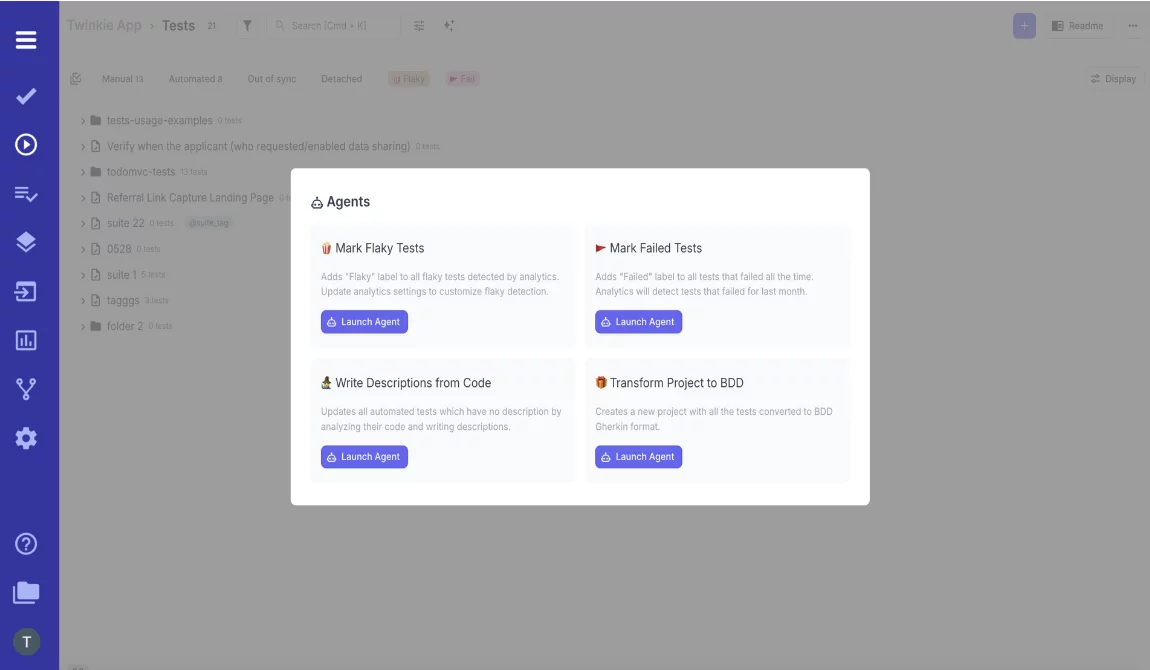
Detect Playwright flakiness you can in a 2 way as you can see with the Analytics Dashboard widget and the AI Testing Agent. Flakiness detection helps ensure Playwright tests in the framework are dependable enough to be run automatically and frequently.
With generated reports for CI\CD pipelines, teams can create quality and deployment readiness reports automatically from their continuous integration and delivery processes. It can be achieved through the integration with the testomat.io tool.
How to Choose the Right Type of Playwright Reporter
Before selecting the type of reports, it is essential to define the needs of your team, your project scale, and the level of detail you require, and then adapt Playwright reporting to those needs. Here are a few considerations to make when deciding which type of Playwright reporting you need:
- Purpose of the Report. Your report should be driven by the main testing goals and determine the need for either quick developer feedback or comprehensive stakeholder updates.
- Size of the Test Suite. If you are testing small, a short console reporter (List or Dot Reporter) could be enough for fast feedback. But when the test suite reaches hundreds or thousands of tests, deeper reports like the HTML Reporter or specialized dashboards are invaluable to effectively explore and interpret the results.
- Environment. The testing environment heavily influences reporter choice: for local development, an interactive HTML report is ideal for immediate debugging, while for CI\CD pipelines are a good fit thirty-part Playwright reporting solution for automated parsing and quality gate integration.
- Level of Detail. The depth of understanding the results of tests is important. For detailed debugging and root cause analysis, the HTML Reporter (and it’s Traces, Screenshots, and Videos) provides every detail of any failure, up to the kind of failure, and the place in the application where it failed. If the level of detail is minimal, you can select the Line or Dot Reporter to get at-a-glance feedback.
- Data Storage Needs. If you require the historical analysis, there are reporters that generate HTML and JUnit XML files for further review. For long-term trend analysis or integration with test management systems, you can select a reporter which will sends data to an external database or service, often through a Custom Reporter. But our test management software testomat.io also support this option.
- Customization Options. If one of the regular reporters simply isn’t generating the data exactly like you need, the way the data’s aggregated, or if the data needs to be submitted to an external system, the Custom Reporter is a good option for matching the specific reporting workflows.
- Test Management Systems (TMS) Integration. Some reports (JUnit XML, for instance) can be readily integrated with a variety of TMS to collect data in one place. So, if you need real-time monitoring of test runs, failures, and trends, you need to consider whether the report is required to directly push results to a TMS for better visibility.
- Team Cooperation. When selecting, you need to make sure the report format can be shared among team members to get a better understanding and make decisions. comprehension of the situation. If the team uses certain tools (such as Jira or Slack) to communicate with each other, then test management software might be suitable to facilitate your test result display.
Benefits of Reporting in Playwright
- Thanks to Playwright reporting, teams can get comprehensive details about test runs and quickly pinpoint the root cause of issues.
- Teams can assess the suite of results in real-time, speed up the feedback process, and maintain a continuous development flow.
- With shareable reports, teams can quickly discuss test results with business stakeholders, even those without technical backgrounds, to accelerate understanding across development, QA, and product teams.
- Teams can prevent faulty code from being deployed and ensure continuous quality thanks to automated quality gates in CI\CD.
- Teams benefit from customizable Playwright reporting options to tailor their reports to unique requirements.
- Teams can generate report files (like HTML or JUnit XML), archive results, and analyze performance, failure rates, and trends over time.
Challenges in Playwright Reporting
There are some challenges in Playwright Reporting that teams should be aware of:
- While Playwright offers custom reporters, creating interactive reports beyond the built-in options can demand significant development effort.
- Teams face difficulties in identifying key issues in the test reports in terms of including too much information in the suites of tests.
- The use of multiple environments, including various browsers and devices, can contribute to generating unpredictable results.
- Flaky tests are prone to producing false positives or negatives, which might result in inaccuracy in the reports.
- Slow page loads may cause an increase in reported execution times and impact accuracy.
- Complicated user flows and dynamic content can overwhelm reports with redundant information.
Tips for Effective Playwright Reporting
Here are some tips to follow to enhance the Playwright test reporting:
- Before executing the tests, it is essential to clearly define what you’re testing and focus on metrics which will help you determine what success looks like.
- You need to create a reporting format that is easy to interpret and helps teams resolve issues quickly. Likewise, the content can be presented in HTML format or offered as a downloadable PDF.
- For better understanding, you need to add screenshots/videos to your test reports to provide visual context and make sure they are shareable.
- You need to use CI tools to automatically trigger the report creation and distribution after each test run.
Want to Reap the Benefits from Playwright Reporting?
With good test reporting, you can turn testing data into actionable insights. Using Playwright’s reporting tools allows teams to get useful information about their results, uncover problems early, and make testing better. Thanks to diverse types of reporters in Playwright and integration capabilities, teams can integrate multiple reporters and even create custom ones to meet their different needs in testing.
If you are interested in simplifying Playwright reporting and integrating it with testomat.io for better management, do not hesitate to drop us a line and learn more about the services we provide.