

There is a widespread problem that should be addressed today, and it is the primary reason for this article. According to statistics, about 50% developers and test automation engineers use console.log for debugging as their primary tool for finding bugs. While logging is a valid technique, it is slow, inconvenient, and often leads to code clutter. Today, there are far more efficient methods available that can save you a significant amount of time.
If you are coming from a manual testing background and debugging sounds like a mystery, let’s break it down together, starting with the explanation.
Debugging — a clear definition
Debugging is the systematic process of identifying, analyzing, isolating, fixing and verifying the solution to errors (commonly called bugs or faults) in program’s source code or behaviour to ensure it functions correctly.
Within the realm of software testing, the concept of debugging takes on a slightly different glance when viewed through the lens of a tester.
Debugging in software testing
Debugging in software testing is the process of identifying and investigating the root cause of a defect after it has been discovered during testing and ensuring the underlying issue is resolved.
So, instead of just applying a quick fix to make the code run, debugging in testing means identifying and solving the underlying problem(like a disease treatment).
Unfortunately, the reality is that many QAs have not mastered debugging. Those who dive into debug: what are they actually trying to uncover?
QA engineers, debugging operations:
✅ Reproducing the issue reliably.
✅ Collecting evidence (logs, screenshots, API responses, environment information).
✅ Narrowing down possible causes.
✅ Providing developers with sufficient context to fix the problem quickly.
✅ Verifying the fix after implementation.
In addition, in modern Agile environments, debugging is not only a developer task. It is a collaborative process between QA, developers, DevOps, and sometimes product managers. The faster we move from just failed to why it happened, the healthier our delivery pipeline becomes.
To sum up the idea briefly 👀
| Testing | Debugging | |
| Primary goal | Identifies defects, shows the software fails | Identifies the root cause of defects and fix them |
| Mindset | Does it work as expected? | Why did it break here and how do I repair it? |
| Target | Focused on validation | Focused on root cause analysis |
| Who performs it | QA engineers, testers, automation engineers(mostly) | Developers (sometimes senior testers) |
| When it happens | Planned activity (before release, in sprints) | Reactive — after a failure is observed |
| Outcome |
List of bugs / failed test cases | Fixed code + (ideally) new test to prevent regression |
Next, we want to return to the primary point of this discussion ⬇️
The Problem with Print Debugging
Why console.log is not the best approach?
- Time Consumption: You waste time writing logs, restarting the code, and then eventually deleting them.
- Blind Spots: A log only shows what you specifically asked for. If the error lies in a neighboring variable, you have to add a new log and run the code all over again.
- Messy Code: Leaving forgotten logs in the repository is considered bad practice (or “bad form”).
Why is debug better than console.log?
- Breakpoint Management: You can see all breakpoints in one list, and you can enable/disable them en masse without having to go through files to delete a forgotten
console.log - Data Inspection: You can hover over any variable in real time and see its value without having to write a log for each step.
- On-the-fly Value Modification: You can change the value of a variable right during code execution to test a different scenario without restarting the program.
In fact, professional debugging in VSCode is much easier and more powerful than it seems.
VS Code Debugging Tools
Visual Studio Code offers a powerful built-in debugging functionality of various types. Practically, there is nothing you can not do with it. The full info is in the official Microsoft Documentation Debugging section. Here, we will explore only a few fundamental features.
VSCode natively supports JavaScript, TypeScript (CoffeeScript, Dart, Elm, …and everything that compiles to JS), making it the go-to for many developers’ teams.
For any languages: Python, C++, Java, C#, PhP, e.g., there are enough relevant extensions simply by installing on the marketplace.
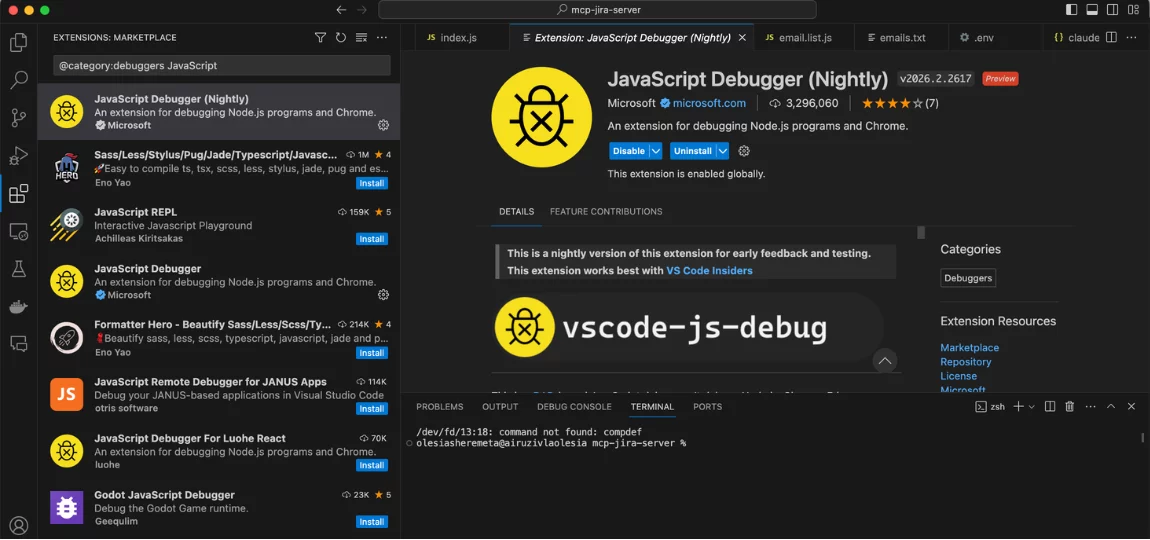
How to start debug?
It is quite easy: Install the extension → Add breakpoints (s) → Run and Debug (↑ ⌘)
That’s all. You can debug!
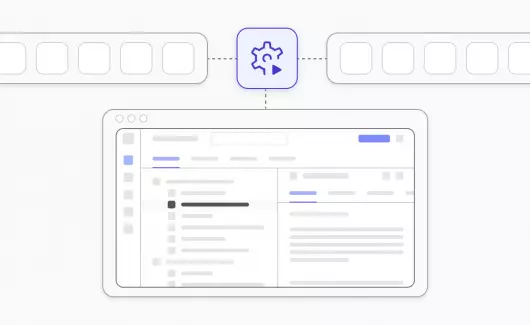
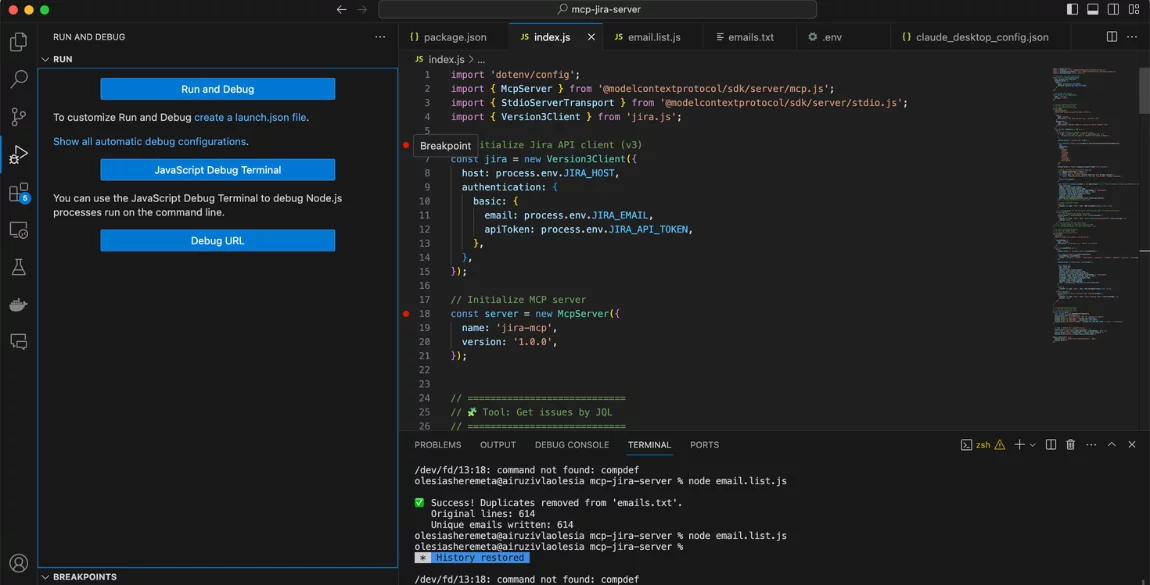
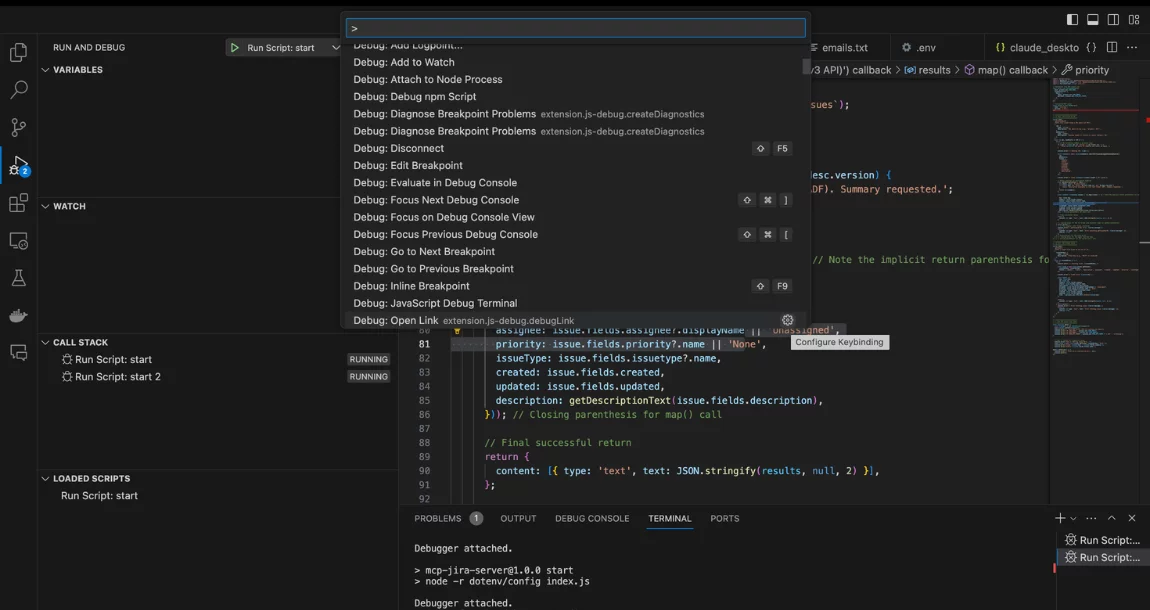
The following screen shows the main components of the debugger user interface:
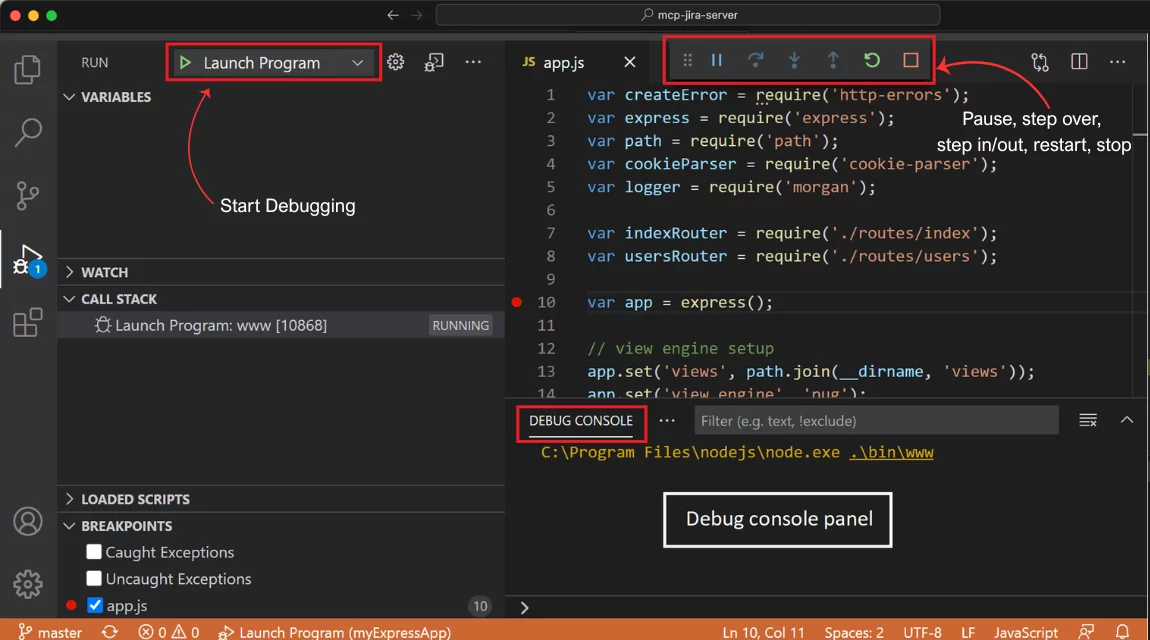
Data Inspection:
- Hover, you can see the variable statements on particular time.
- Watch you can add here all the variables that you want and track them or expressions
- Debug toolbar has buttons for the most common debugging actions.
- Debug sidebar lets you interact with the call stack, breakpoints, variables, and watch variables during a debug session.
- Debug console enables viewing and interacting with the output of your code running in the debugger.
How does a breakpoint in debugger work?
A breakpoint is a marker you can set at a specific point inside a minified line or complex expression that pause run or return message when it reaches ones. You are not limited to placing breakpoints only next to the line numbers in the editor — you can set them at any specific location in the code where you need execution to pause.
Main Types of Breakpoints
Expression
Function breakpoint is triggered when a function with a specific name is called (an expression evaluates to true).
The stop occurs after the line has been executed a certain number of times (convenient for loops).
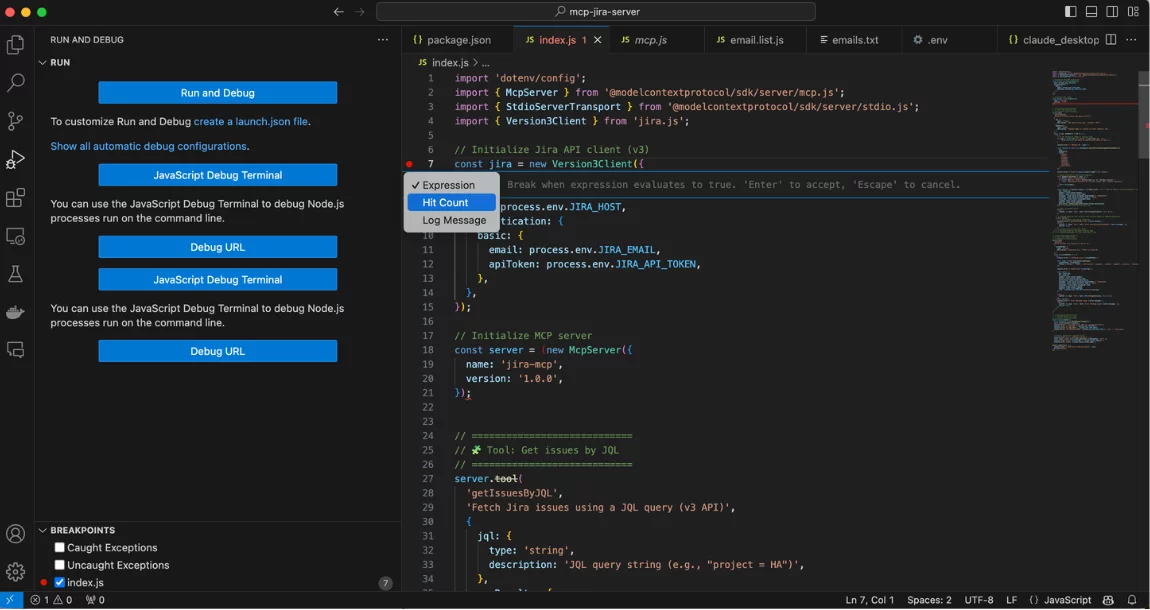
Log Points
Log Points is a “killer feature” that works like console.log , but without interfering with the code. You put a period, write a message, and it is printed to the debug console without stopping the program.
Conditional Breakpoints
Conditional Breakpoints: the code will stop only when your condition is met (for example, color == ‘blue’).
Variables
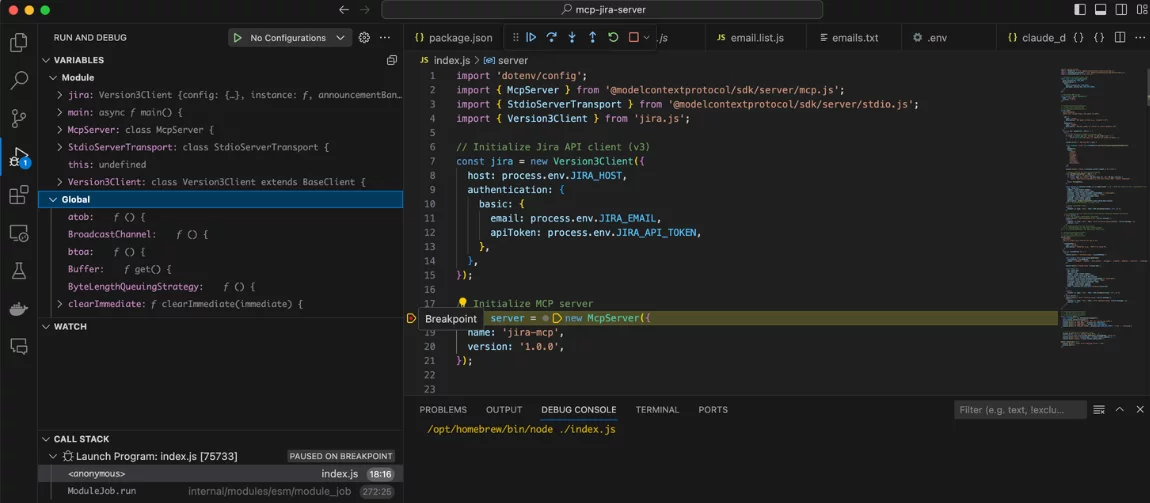
- Copy value
- Update value
- Search
Auto Attach
Open the Command Palette (Cmd/Ctrl + Shift + P). Find Debug: Toggle Auto Attach. This is the easiest way to get started. You don’t need to create any configuration files. Choose a mode (for example, Always or Smart).
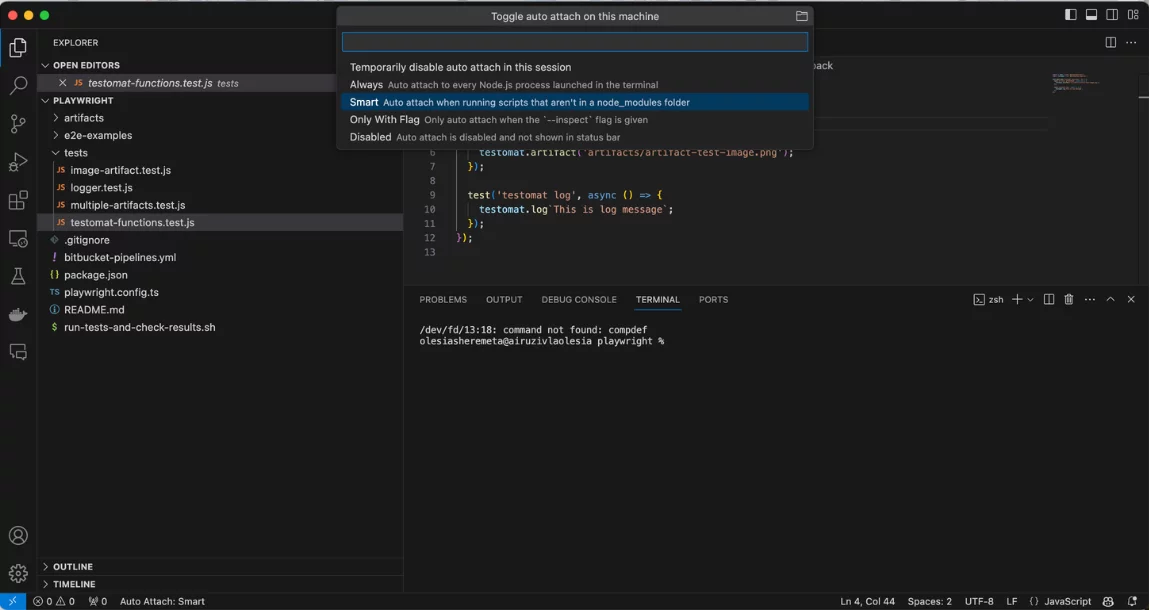
Now, when you run a script from the terminal, VS Code will automatically attach to the process if it finds breakpoints.
Configuration
Automation launch of the web app through the debug menu
As you can see, debugging is easy. It’s much faster than using console.log, in most cases, I think. And debugging provides much more features than we could see so far. Of course, I can hardly get you rid of the console.log dependency in such a short time, but at least now you know that there is another way and a choice for you.
The Importance of Debugging
Debugging is a challenging but vital discipline, especially for resolving defects by automation QA engineers or Devs. Its primary purpose in testing is to stop the “snowball effect” of coding errors and know the reasons for flakiness. By identifying the root cause now, you prevent a single bug from evolving into a series of cascading failures, ultimately saving hours of troubleshooting on more complex issues later and preventing poor code from entering production.