Nightwatch has garnered a reputation as a robust end-to-end testing framework for browser automation. It’s based on Selenium WebDriver and designed for JavaScript automation developers. It comes with an easy-to-use API, secure test executions and simple npm installation process. But for reporting, the native capabilities have their limitations.
Testing goes beyond executing scripts or checking for failures. When reports are spread across HTML files or buried in console output, collaboration becomes harder. Developers lose visibility, QA teams spend extra time sharing context, and product managers miss the overall quality picture.
The Nightwatch native reporting tools provide only a partial view, capture single test runs and don’t consolidate results over time or reveal long-term trends. With Testomat.io’s native JavaScript support, teams can now bring all this data together in one place and keep quality insights accessible to everyone involved.
Limitations of Native Nightwatch Reporting
The moment your testing scales beyond individual developers, Nightwatch’s reporting may become an issue.
- Analytics and insights are practically nonexistent. You get pass/fail counts and execution times, but no visibility into flaky tests, no trends showing improvement or regression, and no way to identify which tests consistently slow down your pipeline. Every test run is a standalone event with no historical context.
- Visualization is minimal. You can’t see your test coverage evolving or spot patterns in failures. For non-technical stakeholders, these reports might as well be written in code.
- Managing multiple environments is a nightmare. When you’re running Nightwatch tests across dev, staging, and production or across different browsers and devices you end up with separate reports in separate folders. There’s no unified view. Comparing results is possible only manually.
- Dealing with multiple testing tools like. You’re probably stuck with separate reports for each. Each tool spits out its own reports, making it a pain to get a single view of your test results. So, each tool generates its own reports, making it difficult to obtain a single view of your test results.
Getting a clear picture of your test status becomes a real headache. These aren’t edge cases. They’re everyday friction points that slow down teams and obscure quality signals.
How Testomatio Enhances Nightwatch Reporting
Testomat.io doesn’t replace Nightwatch; it elevates it. The framework continues to handle test execution and browser automation through Selenium. But instead of dumping results into static files, Testomat.io captures that data and transforms it into something teams can actually use.
✅ Import Auto Tests and Sync Everything in One Place
Centralized Management enables you to view, organize, and track Nightwatch tests in one place, automatically syncing updates from the source code without any manual effort.
✅ Real-Time Reporting Dashboard
The moment your Nightwatch tests complete, results flow into Testomat.io’s dashboard. No waiting for builds to finish and then hunting through server folders. The UI displays test runs in real-time with pass/fail status, execution details, and failure context. You get a centralized view of all test activity across branches, environments, and timeframes.
✅ Flexible Test Execution
Testomat.io can trigger test runs. From the interface, you can launch your Nightwatch suite on-demand, select specific test cases or suites, and execute them across different configurations.
Need to run smoke tests against staging before a demo? One click. Want to verify a bug fix across multiple browsers? Select the tests, choose Chrome and Firefox from the configuration, and go. This flexibility turns your test automation into an interactive tool rather than something that only runs on a schedule.
✅ Test Documentation
Tests are living documentation of how your application should behave. Testomat.io makes this explicit by linking automated tests to requirements, user stories, and feature descriptions.
When a coder puts in a feature, they instantly see what tests check if it works. If tests fail, everyone knows what user thing went wrong. The how-to guide stays up-to-date because it’s right there in the tests, not on some old webpage.
You can throw in notes, labels, and rules for the tests using the interface. People who aren’t techy can read these notes and get what the tests cover without having to read code. It helps people in QA talk to the rest of the company.
Quality assurance doesn’t start and end with automation. Our test management tool is much more. It sets up a single spot where stakeholders can see the whole project picture – what is automatic, what’s manual testing, and how it all fits with the features and needs.
👉 Let’s get started with our Nightwatch tutorial. To start successfully, you can find your first Nightwatch testing project on our official GitHub repo page. The tests check the main user actions: logging in, buying stuff, and changing profile info in Chrome and other browsers with Selenium WebDriver. Just download it by following the link! Steps you need to follow to run the example:
Nightwatch + Testomat.io in Action
#1: Create A New Test Project
Sign up at the TMS Dashboard, you can find two options for creating a project:
- Classical Nightwatch project: test descriptions are presented in the markdown format
- BDD Nightwatch Cucumber project: tests are presented in Gherkin format
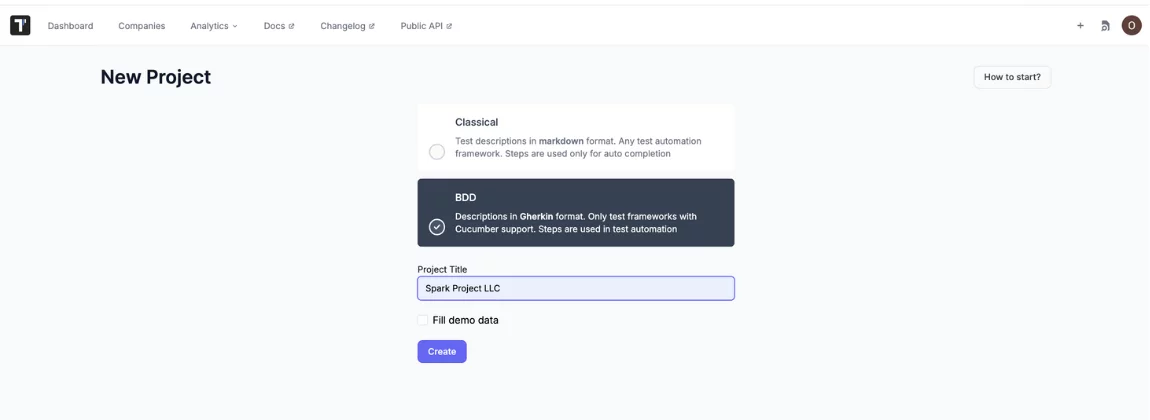
Once you made a choice, write down the title and click the Create button.
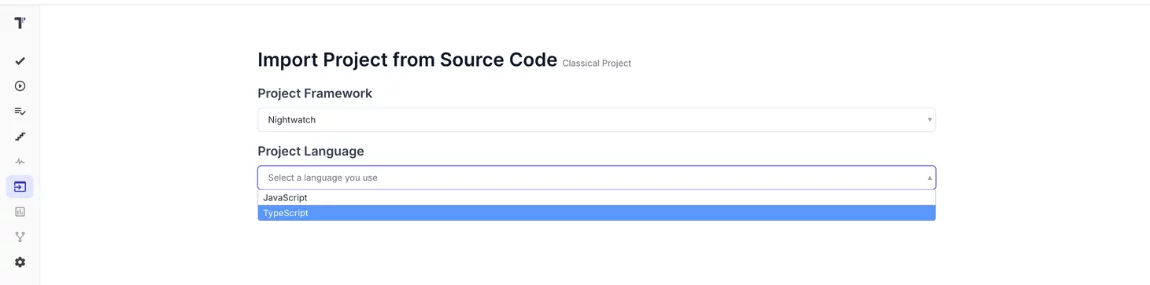
#2: Import Nightwatch Auto Tests into test management
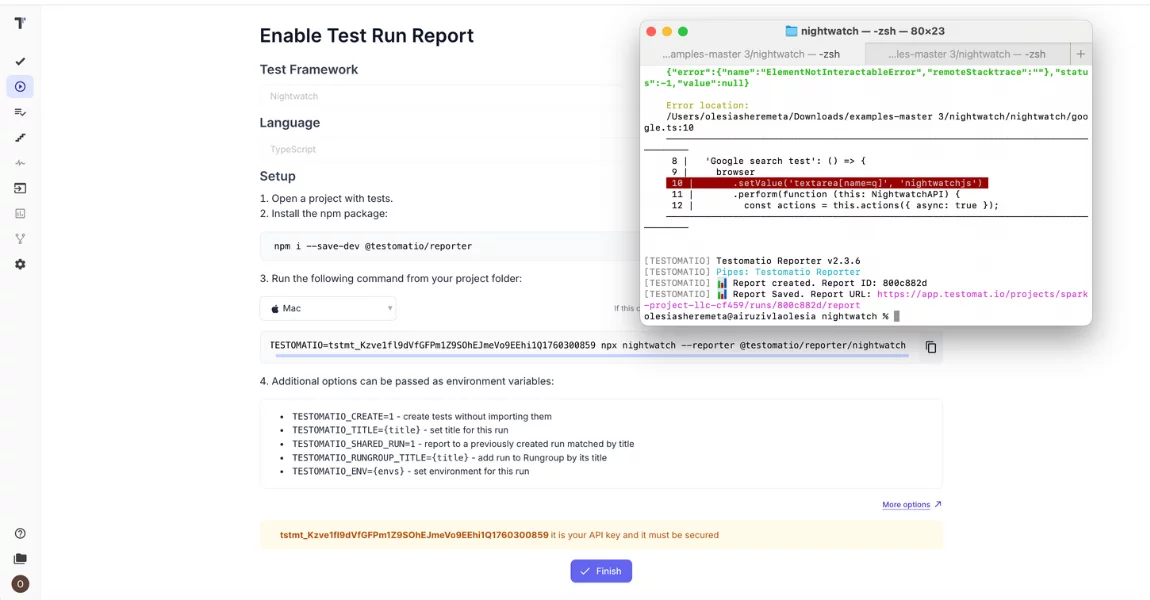
Select Nightwatch as your framework during setup. Download tests from the source code by choosing Import automated tests in the drop-down menu.
Download Nightwatch automated tests. Get your API key TESTOMATIO=your_api_key from the UI and set it as a variable in your command:
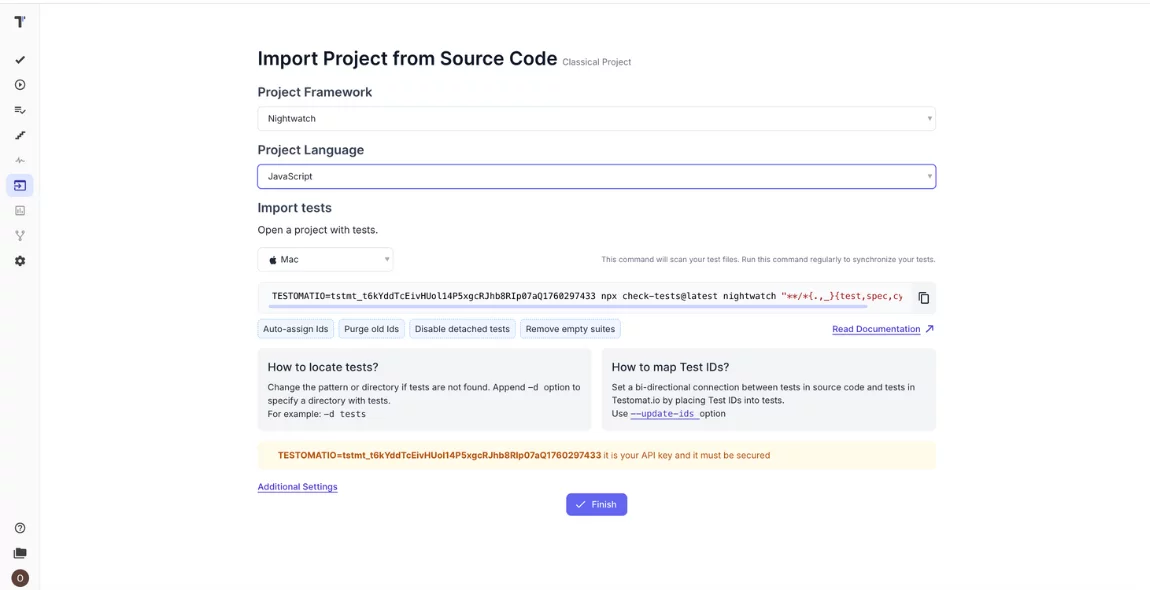
As you can see, our testing tool is absolutely smart. Copy just the command and run it in CMD to scan your tests:
npx check-tests@latest nightwatch "**/*{.,_}{test,spec,cy}.js"
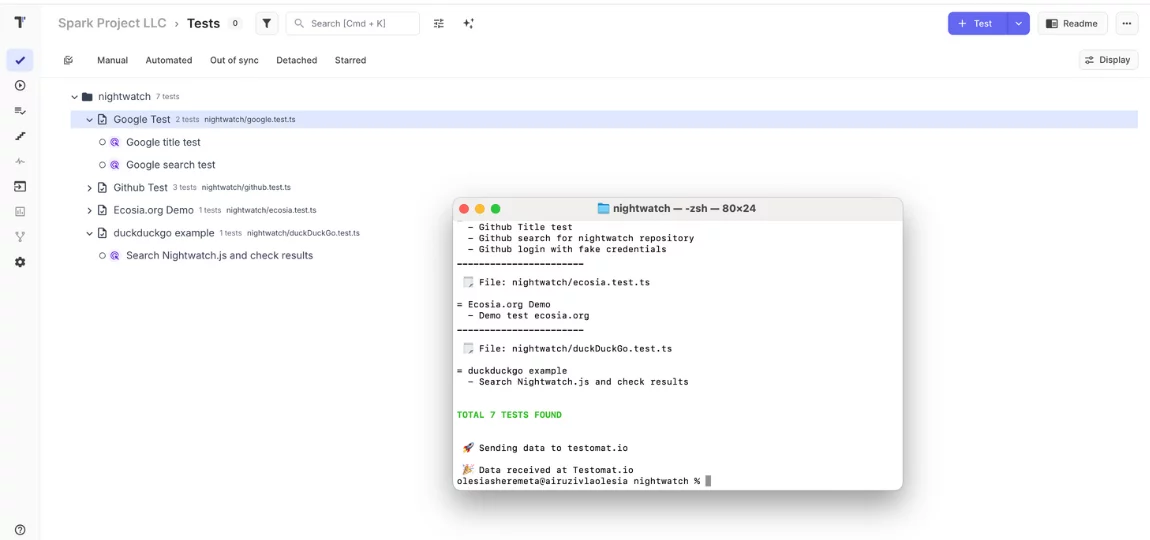
Hoora! And our tests are successfully placed in the test management system. It delivers powerful features to streamline the testing process.
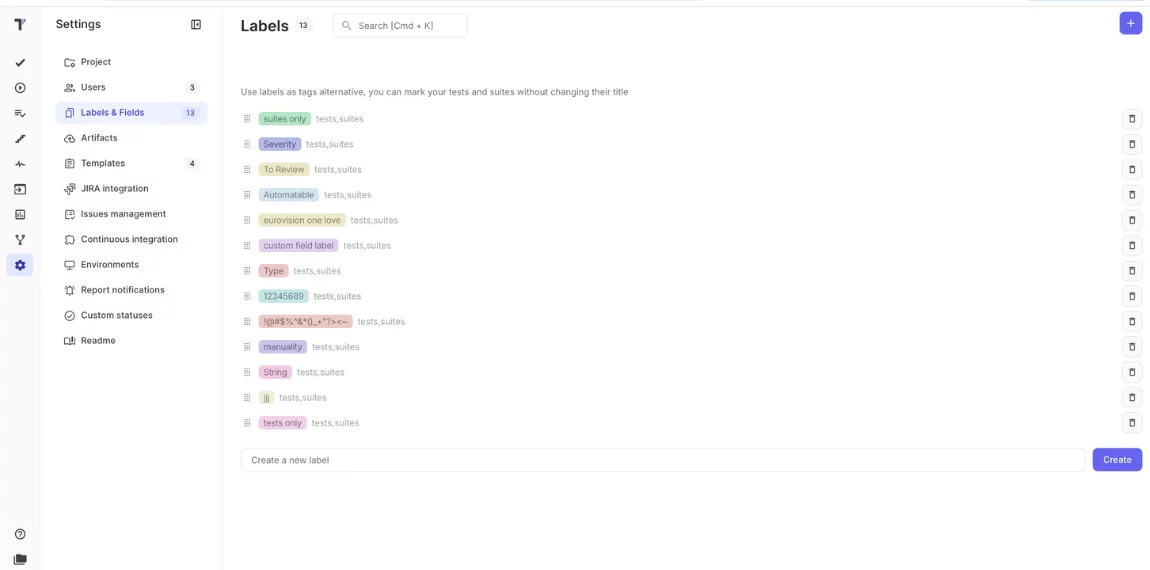
Organize your Nightwatch tests in the best way
Now, we can structure your Nightwatch tests more efficiently than ever. Flexible tags, labels and custom fields serve as simple, that allow users to mark tests, suites, runs, plans, and steps with keywords to categorize them, filter faster and creation of tailored custom reports based on these attributes.
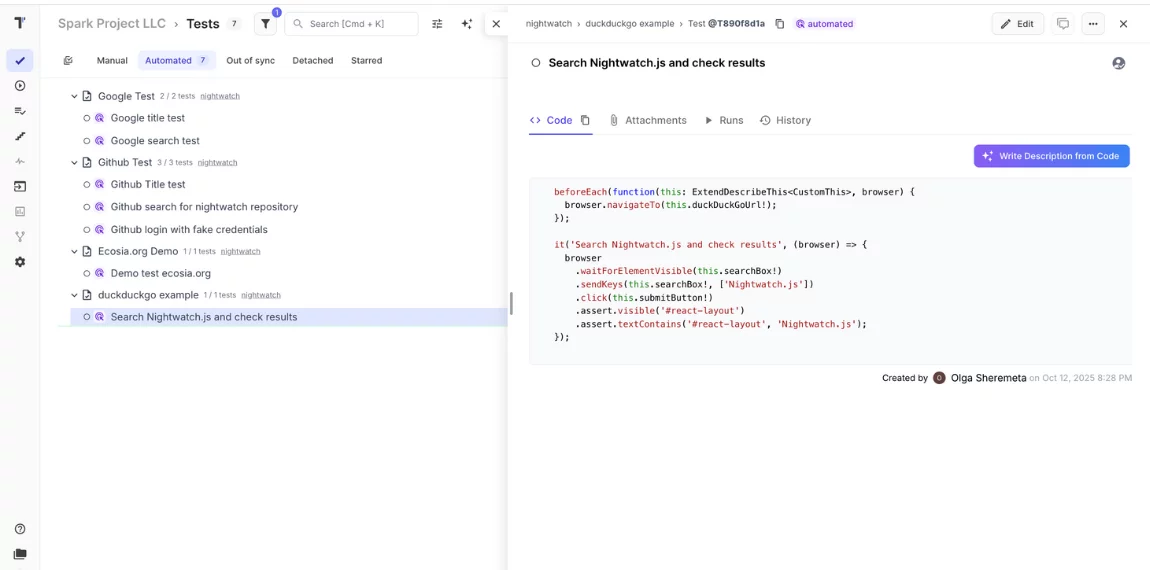
It is a view of our single Nightwatch automation test. An AI Agent allows improve it with generative Description from code. Yep, you are right — source test context from code.
#2: How Do I Create A Report In Nightwatch?
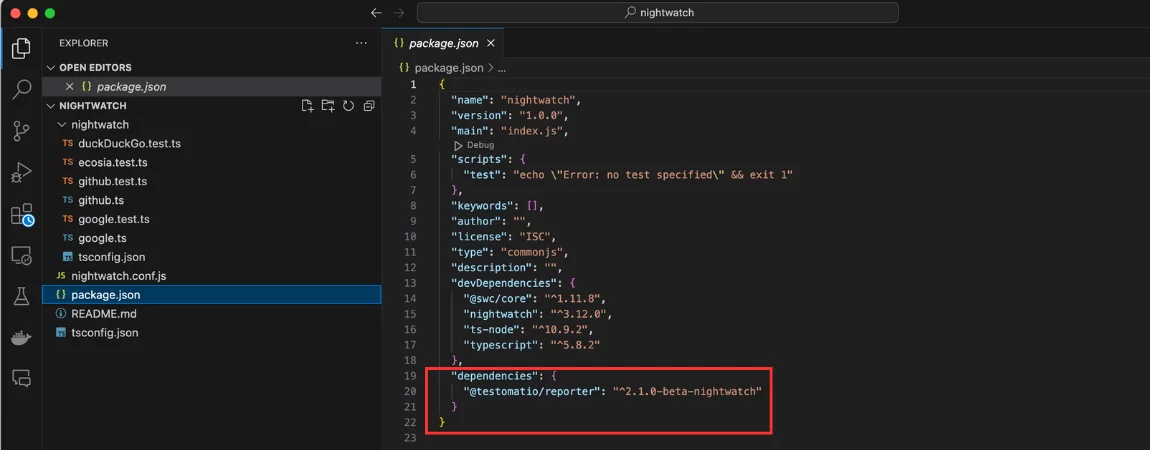
At first, enable the reporter module in your Nightwatch repository, use one of your favorite package managers:
npm install @testomatio/reporter --save-dev
pnpm install @testomatio/reporter --save-dev
yarn add @testomatio/reporter --dev
This adds the reporter to your project dependencies. Make sure that the reporter configuration file looks like:
You can include the API key and other additional options in the .env file. More details about it in the Docs.
TESTOMATIO={YOUR_API_KEY_HERE}
TESTOMATIO_CREATE=1 # Enables auto-creation of new tests
TESTOMATIO_SUITE=@S1235678 # Places tests in a specific suite by ID
Execute your Nightwatch suite as usual:
npx nightwatchIn this case, the test results automatically sync to Testomat.io or just follow the UI hints, copy and paste to see the result.
View results in the dashboard.
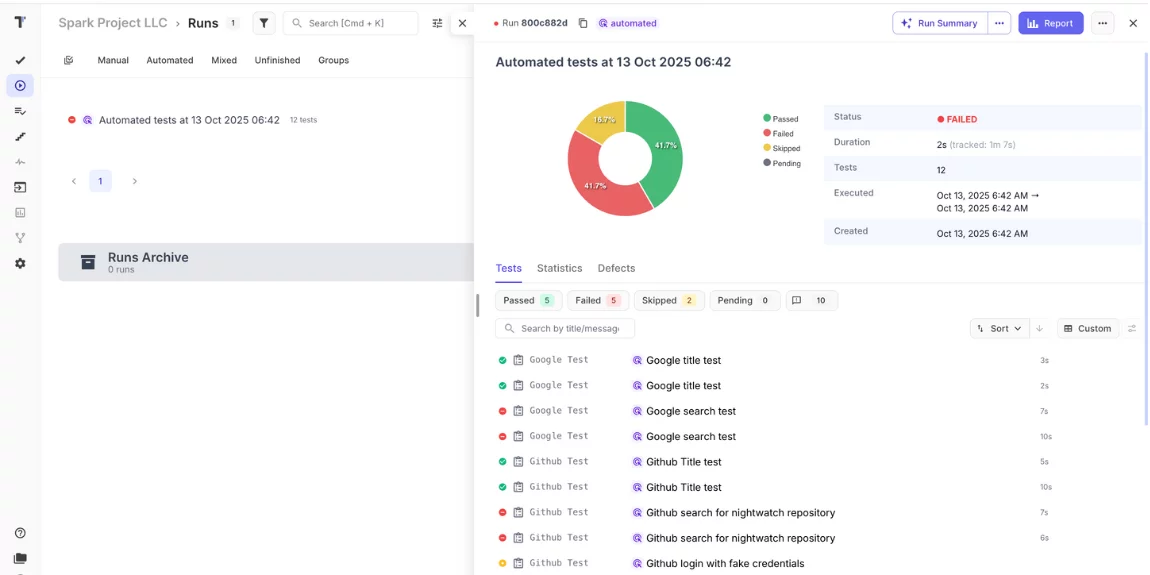
Open your Testomat.io project and navigate to the test runs section. You will see your latest run with detailed results, execution times, and any failures with full context.
CI\CD Integration
CI\CD pipelines are how things get done these days, and Testomat.io fits right in. You can hook it up to GitHub Actions, Jenkins, GitLab CI, or whatever tools you’re using with our reporter thingy.
When your pipeline runs Nightwatch tests, the results automatically pop up in Testomat.io. You will see the build status right there on the dashboard with all the test info, so you get a clear picture of what’s going on with your deployments. If tests fail, your team instantly knows which ones stopped the deployment and why. Setting it up is pretty easy: drop your CI\CD API key into the test management dashboard config, and the reporter takes care of everything else.
Notifications & Alerts
Silent failures waste time. Testomat.io sends alerts right to Slack, Microsoft Teams, or email when tests finish or when certain limits are reached.
See What’s Up with Your Tests
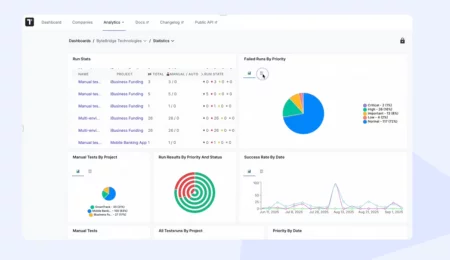
Testomat.io lets you spot slow tests, find features that fail a lot, and track test coverage as you add stuff. It also points out flaky tests that mess with your confidence. These are easy to miss in normal reports but stand out in Testomat.io’s reports.
The metrics help you make data-driven decisions about where to invest testing effort. Should you refactor slow tests? Are certain modules more error-prone than others? The platform answers these questions with graphs and trend lines, not guesswork.
You can find more setup choices in the docs at docs.testomat.io. There, you will see how to set different report styles, and cool stuff like setting up parameterized or parallel tests.
Compared to the default Nightwatch HTML report, a static page with basic tables, Testomat.io gives you an interactive interface with filtering, search, historical comparison, and collaboration tools. The difference becomes obvious the moment you need to do more than glance at pass/fail counts.
Benefits for QA Teams
The impact of better reporting extends beyond prettier dashboards. It changes how teams work.
| Area of Impact | Benefits for QA Teams |
| Faster Debugging | Access detailed test reports with screenshots and logs in one place. |
| Cross-Team Communication | Share real-time test results with PMs and Devs through a unified platform. |
| Actionable Quality Insights | Identify recurring failures, flaky tests, or weak coverage using analytics. |
| Improved Coverage Visibility | Track test coverage evolution over time. |
| Time Efficiency | Automated report generation and notifications remove repetitive manual work. |
| Increased Release Confidence | Clear quality trends and transparent results build team trust in automation. |
Conclusion
Nightwatch is great at automating browsers and running tests. JavaScript API, Selenium Integration and npm ecosystem Slated as a robust solution along with another option for end-to-end testing is called Mocha. But native reporting: console log statements, raw HTML files and fragmented JSON just doesn’t cut it for the needs of modern development teams.
Testomat.io makes for a scalable, collaborative and analytics driven reporting of your Nightwatch runs. It consolidates manual and automated tests in a single workspace, provides real-time visibility into testing as well as fast feedback across frameworks, and turns test results into actionable insights. The company provides a platform that connects QA, developers and stakeholders in the quality feedback loop enabling faster innovation without fielding support tickets.
If you’re stuck running Nightwatch tests and frustrated with limited reporting, fragmented tools or finding it difficult to communicate your quality status then take a look at Testomat. io solves these problems directly. Try Testomat.io with Nightwatch today and see how proper reporting changes your testing workflow.