Performance testing is a type of software testing that involves evaluating detailed performance metrics such as responsiveness, application scalability, speed, system stability, and the ability of a software product to perform properly under certain conditions. It ensures that the digital product runs smoothly and provides the best user experience.
This testing process is critical for a digital solution to work fully after release. It requires significant experience and expertise from QA teams. It also requires the use of specific testing tools designed for running performance tests.
— What are performance testing tools?
🤔 What should you pay attention to when choosing a solution for your project?
— What modern performance testing tools are available on the market today?
About this and more, see further in the article 👇
Performance Testing Tools & How Do They Work
Performance testing tools are different platforms that are designed to facilitate test creation, test execution and monitoring the progress and results of performance testing.
They all differ in their functionality and capabilities, apply to different performance testing types, and support various applications.
However, all performance testing tools have one thing in common – they are used at all stages of the STLC – software testing life cycle:
#1: Setting Up the Testing Environment
At this stage, QA specialists must specify the app or system to be tested and:
- Identify users. Before starting, it is important to understand who will be interacting with the software application. It can be experienced users, regular consumers. You should also keep borderline cases in mind.
- Design workloads. Priority should be given to modeling realistic workloads that mimic real-world user behavior.
- Prepare testing data. It is worth considering all possible variants of interaction with the system, including boundary cases.
#2: Create Various Test Scenarios
To write realistic scenarios, the first thing the team should do is to define its goals. What response needs to be tested? Testers should also establish a clear performance benchmark against which the results can be compared.
After that, you can proceed directly to creating test scenarios, taking into account all the actions to be performed during verification.
#3: Test Execution
During the startup and execution phase of the test, the performance testing tool works like this:
✔️ Typically performance testing tools create virtual users to simulate real user conditions.
✔️ These users send requests to the system under test, i.e., generate incoming traffic.
✔️ The tool distributes user load according to test scenarios.
#4: Track Test Result with Metrics Monitoring
Top performance testing tools provide their users with diverse, detailed reports. They provide real-time monitoring and analysis of test results at the end of the check.
Based on such reports, teams can determine the cause of system degradation, identify bottlenecks, document the detected performance issues as problems, and pass them on to developers for timely fixing.
At each of these stages, performance testing tools can ease the tasks of testers by automating repetitive actions and providing advanced functionality. In addition, modern platforms are suitable for different types of performance testing.
What can performance testing be? Let’s talk about it further 😀
Key Types of Application Performance Testing
With the help of performance tests, you can check different aspects of software product operation. This is available due to the existence of several performance testing types:
- Load testing. With its help, you can evaluate system behavior at a certain user load.
- Stress Testing. This testing type is used for in-depth analysis of software application operation in extreme conditions. Stress tests allow you to determine the maximum allowable loads for normal functioning of the system.
- Scalability Testing. This type of test is used to investigate whether the system can easily scale to handle different loads.
- Spike Testing. Allows you to test how the system reacts to a sudden increase in load.
- Endurance Testing (or soak testing). This type allows you to evaluate application performance over a long period of time under an increasing number of users or tasks. It can be used to identify specific problems, such as memory leaks.
- Volume testing. With its help, teams can check whether the system is able to process high volumes of information or transactions.
- Configuration Testing. Allows to compare system reacts under different hardware and software configurations. This helps to determine the best combination of configurations to ensure optimal performance.
- Latency Testing. It allows you to measure the latency in response time under different load conditions.
When choosing the best performance testing tool for your project, it is important to think ahead of time about what types of tests you will need to run. In addition, there are other considerations to take into account.
How Do I Pick the Right Performance Testing Tool?
When exploring the variety of tools for running performance tests, consider the specifics of your project and the characteristics of the solution itself, namely:
- Testing objectives. Determine what exactly you are going to test. A platform that supports a specific performance testing type or a more generic solution may be sufficient.
- Compatibility with the digital infrastructure project. Check how easily the tool is integrated with other platforms used on the project. Also check if it supports technologies with which the application under test is created.
- Quality of support and ease of use. Make sure that you can quickly start tasks to do in your test scenarious and get answers to all the questions that arise during QA activities. For this purpose, the tool should have a user-friendly interface, a large community and high-quality documentation.
- Built-in reporting features. Check if the tool offers real-time monitoring and other features for tracking the progress and results of testing. This will help you avoid resorting to third-party platforms to create reports.
- The ratio of cost to available features. Note – there are open-source performance testing tools on the market, but their functionality may be somewhat limited. Check if it can fulfill specific requirements for your project.
Now you know what to look for when choosing your best tool for an application’s performance testing. It’s time to move on to a review of the most popular performance testing tools on today’s software market.
Apache JMeter
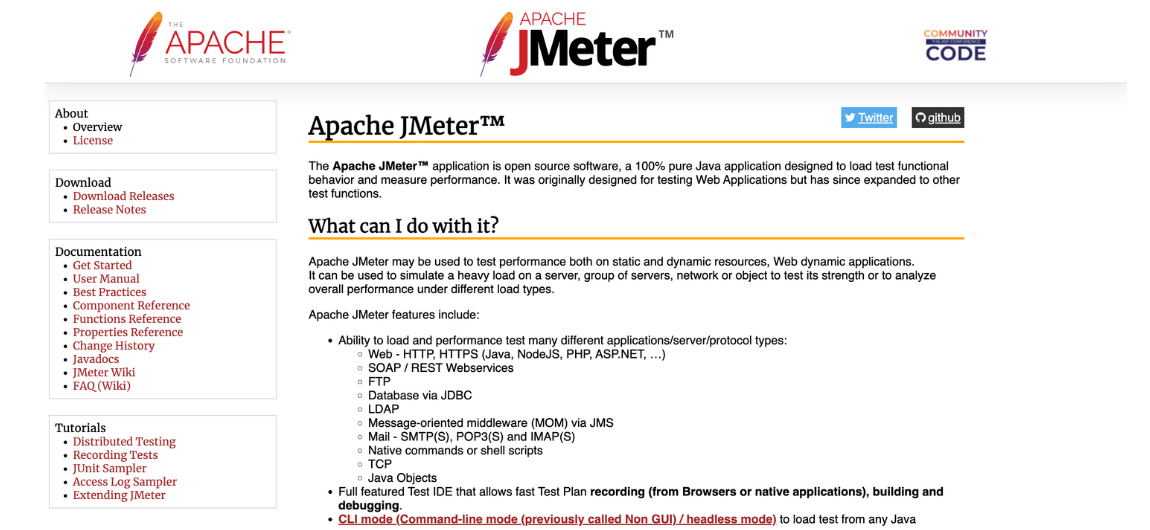
This is an open-source performance testing tool supported by the authority Apache Software Foundation. Jmeter is a popular choice for QAs all over the world while a years. It is used to assess application scalability as well as run load tests. It can be used to analyze how a system behaves under stress. This way, you can make sure that the software product meets the defined performance metrics.
Key JMeter functionality:
- Cross-platform. You can use the tool regardless of the platform – it works on Windows, macOS, Linux, and other platforms. The only prerequisite is that Java is installed.
- Support for various communication protocols. JMeter supports HTTP, HTTPS, SOAP, REST web services and other protocols. This makes it a universal tool.
- User-friendly graphical user interface (GUI). It allows you to easily create and manage test plans.
- Advanced load testing capabilities. Among other features found in many load testing tools, Apache JMeter allows you to alternately reduce and increase load. It provides different load levels – constant, increasing, and peak. This creates a simulation of real user interactions.
- Run via the command line interface. This feature makes the tool suitable for CI\CD automation pipelines.
- Support for mobile testing. For this purpose, the tool simulates HTTP requests from mobile devices or applies traffic capture through a proxy server.
- Extensive integration capabilities. JMeter easily integrates with third-party performance monitoring tools to track key metrics. It is also capable of integrating with CI\CD services, including Jenkins, GitHub Actions, and GitLab.
Katalon
Katalon is a comprehensive AI-based platform. However, it can also be considered as a performance testing tool designed for checking the quality of API, desktop, web and mobile applications. The solution is characterized by a user-friendly UI, offers users advanced functionality and features good scalability as the project grows.
Here are some of Katalon’s key features:
- Scriptless approach. The tool supports test creation without deep programming knowledge – so-called scriptless automation.
- Object repository. Katalon gives users access to a rich repository of test objects, making it easy to maintain tests.
- Built-in test management features. Testers can efficiently organize and classify test cases.
- Support for data-driven testing. Users can easily integrate data from external sources, including performance data with Excel, CSV files, or various databases.
- Reuse test scenarios. The team can create custom keywords for this purpose, providing encapsulation of common activities.
- Built-in reporting. The tool provides reports and performance analysis dashboards that can provide comprehensive information about test results.
LoadRunner
This is a powerful performance testing tool developed by Micro Focus. It allows you to simulate thousands of users and test how well websites, applications or systems perform under specific loads and various conditions. Thanks to its user-friendly interface, testers can easily identify performance bottlenecks, ensure scalability of the digital solution and guarantee system stability before release.
Key features of LoadRunner:
- VUGen (Virtual User Generator Vusers). Allows you to create test scripts to simulate interaction with system concurrent users.
- Supports multiple protocols. The tool is compatible with HTTP/HTTPS, WebSocket, SOAP, REST, Oracle, Citrix and others. Due to this, LoadRunner supports testing of different types of web and mobile applications.
- Ability to run load and performance tests. The platform allows you to test the application’s performance under expected and high loads. Cloud-based load testing is also available, which is optimal for large projects.
- Scalability Support. With LoadRunner, you can evaluate how well the system is able to scale under changing load conditions – for example, when the number of users or transaction volume increases.
- Built-in real-time monitoring and analysis features. Allows you to monitor and analyze the system’s performance through detailed reports with the ability to visualize results.
- Integration with CI\CD pipelines. The tool supports integration with popular CI\CD services, including Jenkins, Azure DevOps, and GitHub. This allows you to incorporate performance testing into the DevOps lifecycle.
- Efficient management of test scenarios. LoadRunner introduces a Controller feature that allows you to create and manage scenarios. It helps to control the number of Vusers, their actions, and the machines on which these actions are executed.
K6
K6 is a tool whose developers guarantee the best for microservices, web applications and APIs. It features a user-friendly interface and easy integration with CI\CD pipelines. This makes continuous performance testing a part of the software development lifecycle. Extensive capabilities make the solution the number one choice among DevOps teams.
Key K6 features:
- Test script creation. The tool creates test scripts in JavaScript, making them easy to understand and easy to maintain. Code reuse, module import and integration with existing workflows is also available.
- Command line interface. Allows you to run performance tests from a terminal without a GUI. This greatly simplifies test running and makes the tool an ideal choice for CI\CD integration.
- Supports load testing. Great for testing RESTful and GraphQL APIs, as well as for assessing system performance under high traffic with minimal resource consumption.
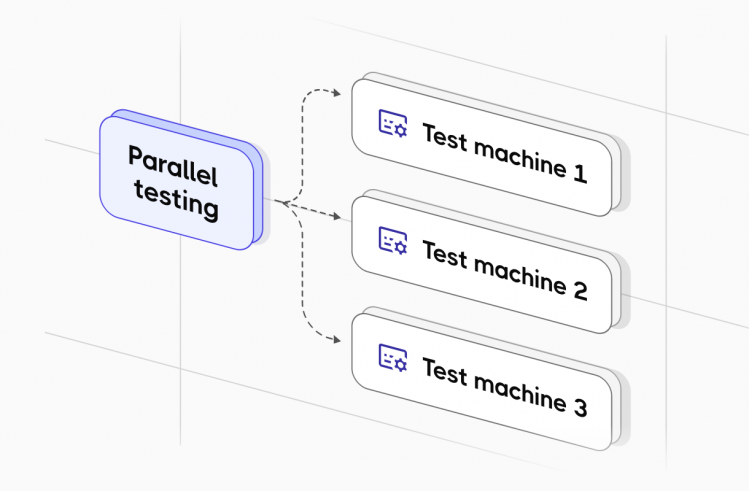
- Distributed capabilities. The tool can distribute the heavy load between multiple machines by running a load generator or via cloud services (Grafana Cloud, etc.).
- Access to a variety of performance metrics. Both predefined and custom metrics are available to collect application-specific data.
- Detailed performance reports. The platform offers teams advanced reporting features. These include real-time monitoring and functionality for creating reports at the end.
- Reusable scripts. Due to their modular nature, test scripts in K6 allow code to be reused in different tests.
LoadNinja
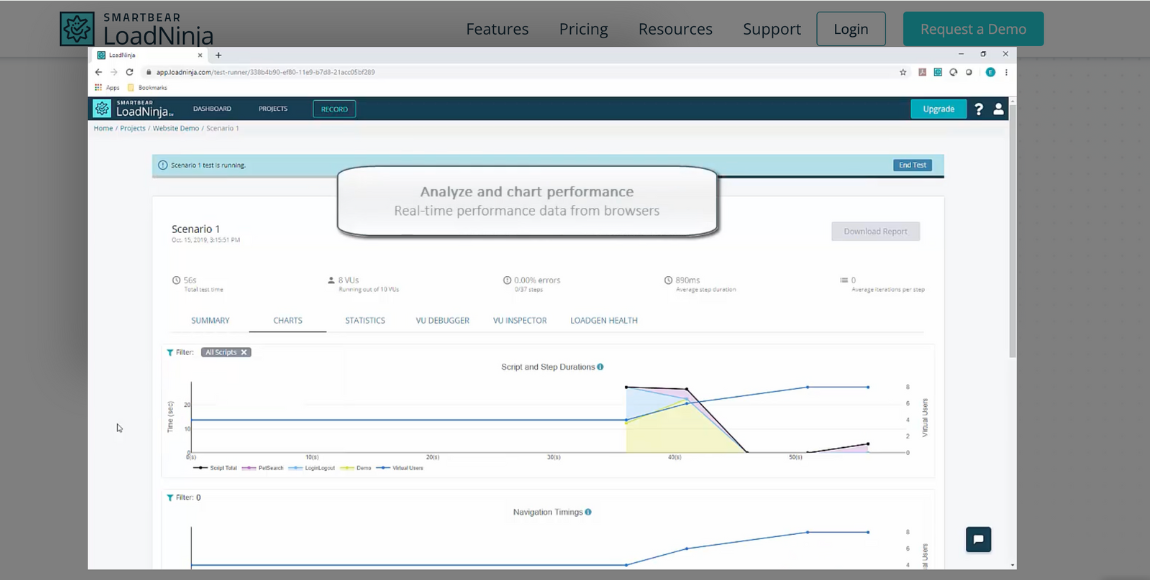
This is a cloud-based performance testing tool that allows you to create and run performance tests in real browsers. This approach greatly simplifies load tests because testers can execute performance tests without writing complex scripts.
The main features of the LoadNinja performance testing tool are:
- Browser-based Testing. The tool allows you to generate loads using real browsers – Chrome, Firefox, and others. Among other features, it captures client-side interactions.
- Scriptless approach. Test scripts do not require coding skills. This is possible thanks to the record and replay feature.
- Cloud based load testing. Supports cloud-based testing, which eliminates the need for complex infrastructure configuration. The tool is also capable of load balancing between multiple servers to simulate traffic from different geographical locations.
- Real-time insights. Allows real-time monitoring of key metrics, such as response times, throughput etc. Detailed reports with graphs are available on the platform. Based on test results users can interrupt and modify tests.
- Tracking metrics on the client side. For example, testers can track and analyze page load time, rendering performance and other things.
- Testing scheduling support. You can schedule test executions over time or at specific intervals. With integration with CI\CD pipelines, you can make automated performance tests part of your DevOps workflows.
BlazeMeter
This is another cloud-based solution among performance testing tools variety. It can be called an enhanced version of Apache JMeter, as BlazeMeter is based on it, but with additional functionality. It provides users with flexible, scalable, and convenient automated testing to check the system’s response.
Key BlazeMeter features:
- Support for multiple protocols. The tool works with HTTP/HTTPS, REST, SOAP, WebSocket, FTP, MQTT and JMS. This makes it ideal for testing web applications, mobile apps, APIs and microservices.
- Load generation in the cloud. The platform allows load generation from multiple global locations to simulate real-world traffic patterns. Requires no on-premises infrastructure.
- Real-time reporting and analytics. Provides users with real-time monitoring dashboards to track key performance metrics.
- Powerful scalability. Allows you to simulate millions of concurrent users, spreading the load across hybrid and cloud environments.
- Support for test run scheduling. You can run performance tests outside of normal business hours, for example, if the build is overnight.
- Support for concurrent testing. With BlazeMeter, you can run multiple test scenarios simultaneously to simulate user interaction realistically.
- Scriptless approach. Offers an easy-to-use user interface for creating tests without coding. This is possible by capturing user actions from the browser with a record performance testing plugin and replay functionality (Google App Store Extention, Blazemeter).
NeoLoad
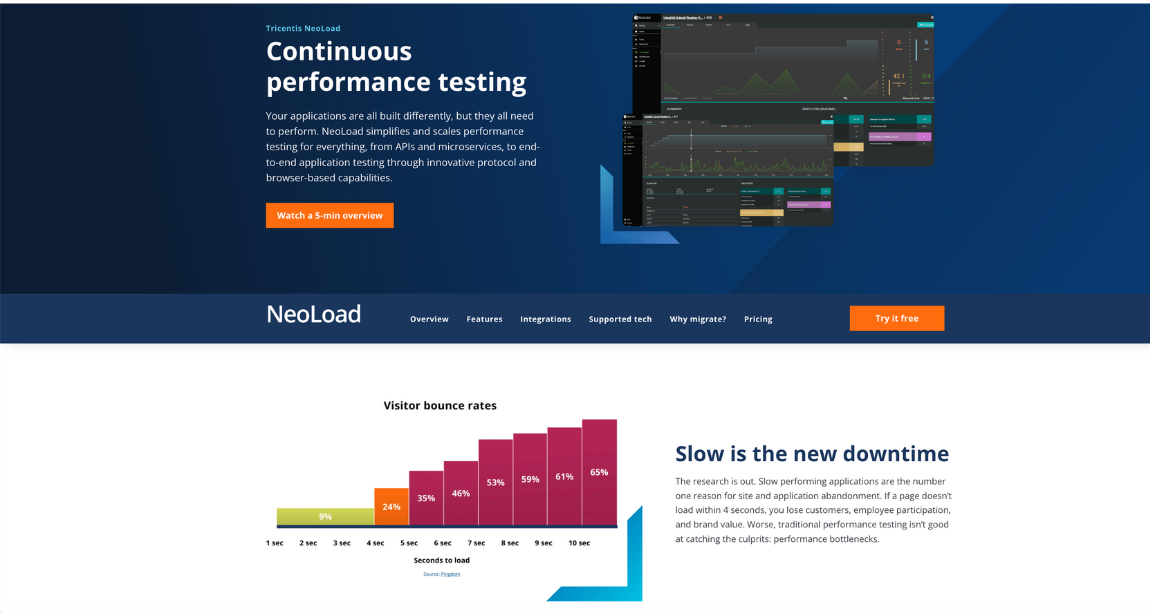
In addition, it is a monitoring tool of the wide Tricentis automated performance testing toolset. It allows you to evaluate application scalability, reliability, and performance. It is suitable for check-up enterprise, mobile, and web applications that must adhere to strict compliance and regulatory standards. It is a favorite with a few QA Managers and their teams because it simplifies complex test scenarios with its user-friendly interface, advanced automation and real-time reporting capabilities.
Basic NeoLoad functionality:
Supports a variety of protocols and technologies. With support for HTTP/HTTPS, WebSocket, SOAP, REST, SAP, Oracle, Citrix, MQTT, etc., the tool can be used to test different types of applications.
- Extensive load generation capabilities. The tool allows the generating of load from local servers and cloud environments. This allows testing digital solutions with security restrictions.
- Creating tests without scripts or with minimal code usage. For this purpose, the tool is equipped with drag-and-drop as well as record and replay functions.
- Reuse of test components. NeoLoad test scripts are modular, allowing them to be used in multiple test scenarios and significantly reducing time.
- Advanced real-time reporting and analytics capabilities. Provides built-in dashboards and integrates with third-party services for in-depth analysis of the system’s behavior.
- Scheduling and automation of testing. The platform allows you to schedule tests to run at specific time intervals. Automation of repetitive tasks is also among its features.
- Comparison of test results. Teams can compare the results of several test runs and evaluate the performance of different versions. This helps identify performance degradation and fix problems in a timely manner.
- Personalized reports. Reporting in NeoLoad includes graphs, tables, and advanced performance data. Reports can be exported to PDF, Excel, or shared via integration with reporting tools.
Gatling
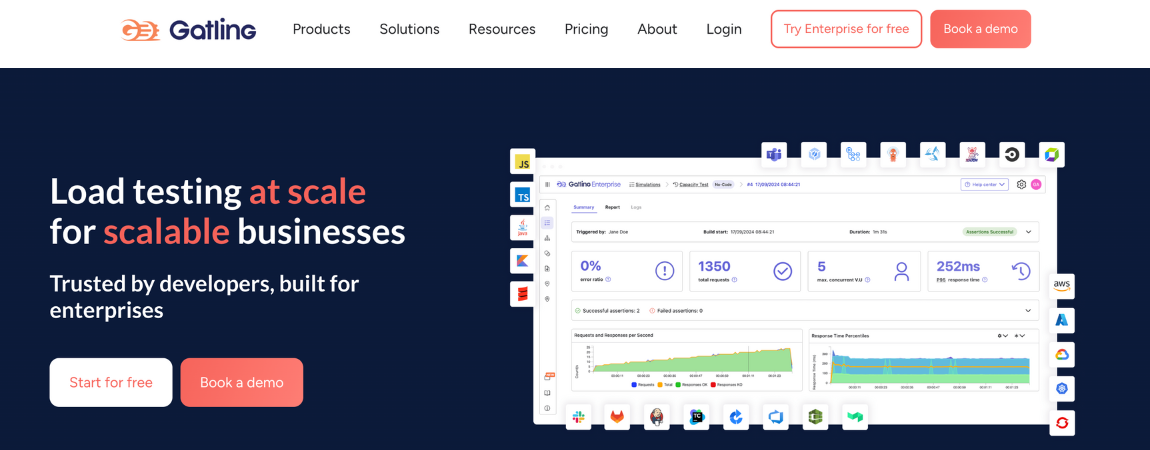
This is a performance testing tool that offers users open source and premium versions. They differ in available functionality and cost (free and paid respectively). However, both offer a wide range of options for assessing application’s performance and efficiency.
Key Gatling features:
- Efficient load generation. The tool allows you to simulate thousands of users, generating high loads with minimal resource consumption.
- Support for multiple communication protocols. The variety of supported protocols is somewhat inferior to the tools described earlier. Gatling was initially designed to work with HTTP/HTTPS, but it also supports WebSocket. That’s why the tool is often chosen for testing real-time applications.
- Test creation based on scenarios. The tool uses the Scala DSL subject-oriented language to write test scenarios. This makes the scenarios flexible and readable.
- Generating tests without writing code. The tool provides a record and replay feature that allows you to record user actions and generate tests without coding.
- Component reuse. Reusable test scenarios are available to Gatling users. Users can reuse components such as authentication tokens, headers, and HTTP requests.
- Error handling and debugging. The platform detects system errors such as network failures, timeouts, and more. Detailed logs are available to users for easy debugging.
Locust
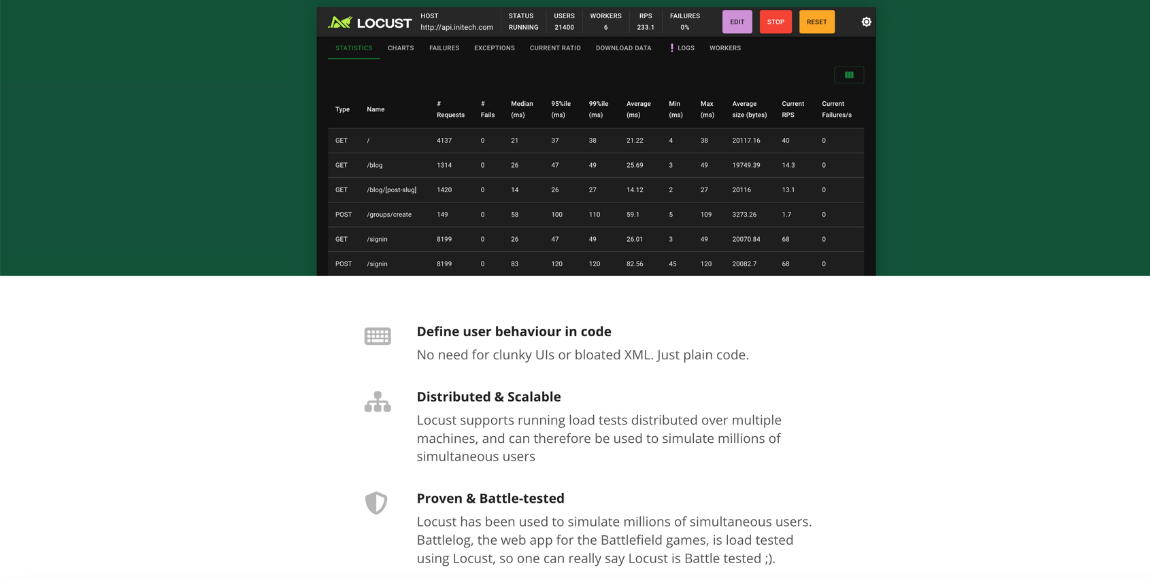
It is an open source load testing tool based on Python. It allows you to generate traffic from millions of concurrent users by determining their behavior using Python code. Due to its flexibility and ease, many teams use this tool for performance and scalability testing of microservices, web applications and APIs.
Key Locust features:
- Writing test scripts in Python. This makes scripting accessible to development teams.
- Web interface for test execution. The tool provides users with a user-friendly interface to run and monitor load tests in real-time.
- Distributed load generation. The platform is able to distribute load between several machines. This is relevant for large projects where one machine is not enough.
- Creation of realistic scenarios. The tool allows you to achieve maximum realism in user interaction. This is possible thanks to modeling random delays, thinking time, etc.
- Step-by-step load testing. The tool allows you to gradually increase the load by incrementally increasing the number of users. You can choose between constant, increasing, or peak load.
- Real-time reporting. The web interface of the tool provides monitoring panels that give you access to test results in real-time. Export of reports to CSV or JSON files is available.
WebLOAD
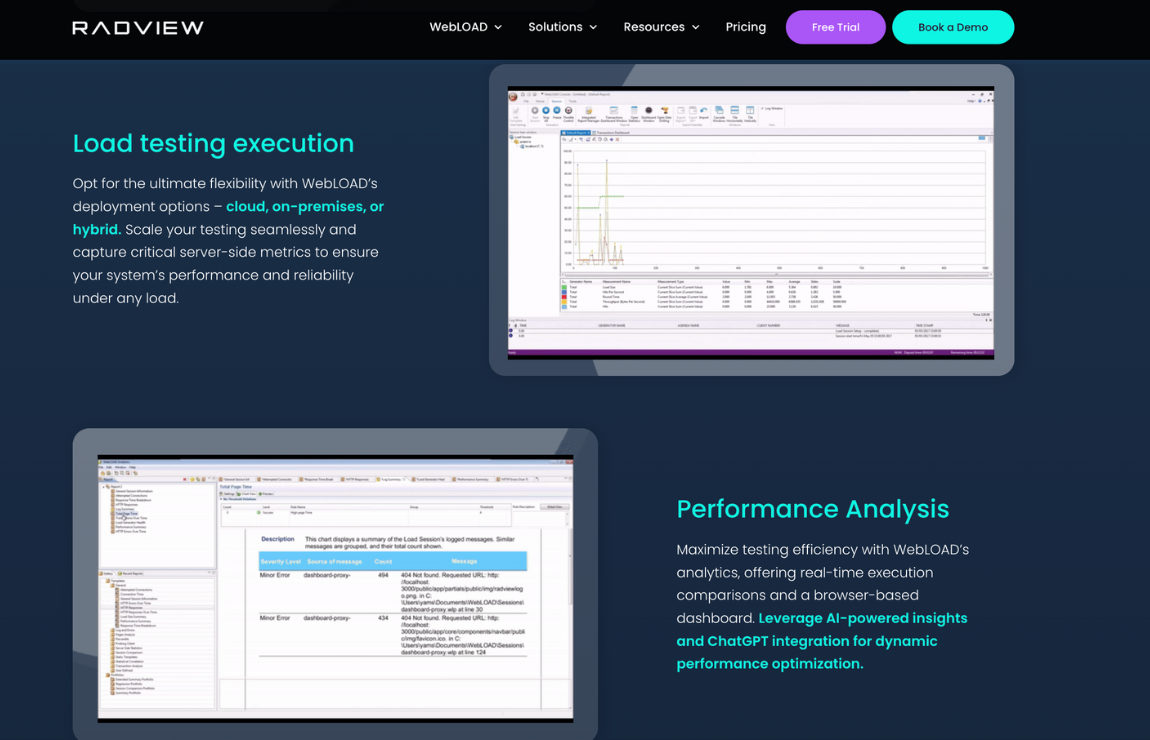
With powerful scripts, real-time performance analytics, and advanced protocol support, this performance testing tool is often chosen by companies for enterprise-level load testing. Its capabilities are sufficient to test not only web applications and APIs but also large-scale enterprise systems.
WebLOAD functionality:
- Support for multiple protocols. A wide range of protocols supported by the tool allows you to test web and mobile applications, API-based applications and enterprise systems.
- Record and playback functionality. The platform supports scriptless approach to scripting. It is able to capture users’ actions and convert them into test scripts without strong coding skills.
- Managing complex workflows. The tool uses JavaScript-based scripts and offers powerful correlation parameterization and dynamic data processing features.
- Extensive load generation capabilities. WebLOAD allows load generation locally or from cloud environments, simulating connections from different geographical locations.
- Real-time reporting and analytics. Built-in reports provide users with detailed performance data and visualize test results with graphs and charts.
- Security and compliance capabilities. The tool allows you to test the impact of different load levels on secure applications and digital solutions that require compliance with strict performance metrics.
- Mobile testing support. The tool is able to simulate mobile network conditions to evaluate mobile application performance.
To Summarize
Performance testing tools are solutions for testing the performance, scalability, and reliability of mobile and web applications and APIs.
Performance testing tools are essential for minimizing user experience issues and enhancing customer satisfaction. Identifying and addressing bottlenecks, these tools help ensure stable overall performance and that applications run smoothly under various scenarios. They have faster load times. Improved reliability. A seamless user experience that keeps customers satisfied and engaged.
Many of the reviewed performance testing tools here are powerful enough to test large-scale enterprise systems. Thus, when choosing the right one within suggested performance testing tools for their project, QA and Back End Developer teams should focus on available functionality, the cost of the solution, and its integration capabilities.
— Do you want your performance testing tool to be listed in our catalog?
👉 Contact your testomat.io manager at contact@testomat.io and find out the details of cooperation.
