The Rungroup Statistic Report is a powerful analytics feature within Testomat.io’s test management system, designed to aggregate and visualize statistics from multiple test runs in that group. It doesn’t merge them into a single run, but presents them side-by-side, showing trends, fluctuations, and status changes.
The matter is that Run Group acts as organized folders for related test executions — such as sequential automated/manual tests united with tags or labels into a logical smoke, regression or related feature’s scopes — allowing teams to streamline analysis without sifting through individual run reports.
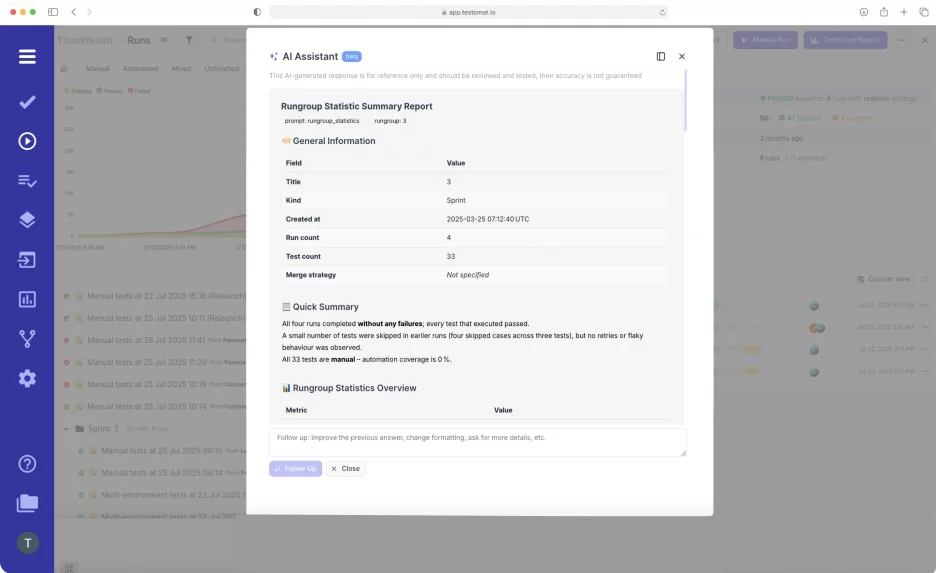
AI Rungroup Statistic AI Report includes:
- General information – depicts quantities of runs, sprint, tests, their duration and percentage of automated tests.
- Quick summary overview – provides an overall snapshot of the run’s health and indicates whether the product is ready for release.
- Run Execution Summary – total unique tests which are executed.
- Recommendation – provides the above process improvements and implementation insights while warning about potential issues.
- Flaky Test Detection – shows pass/fail transitions or required retries.
- Failure Clustering – groups similar test failures together based on their root causes, error messages, or failure patterns..
- Top failed tests – list the tests and their priority.
- Notes – some information derived from this run.
How It Works?
- Create a Rungroup. At first, organize tests into logical groups by environment, tag, or functionality.
- Launch Rungroup. Automation, Manual or Mixed run.
- Open the executed Rungroup from the Runs Dashboard, and apply the button Rungroup Statistic Report.
- Analyze insights, trends over sprints, viewing the output, if needed, drill down into specific tests.
- Act on data by utilising AI-driven recommendations, like checking skipped tests or refactoring flaky tests.
For hands-on setup, check the Testomat.io Docs on Run Reports.
Key Benefits of the AI Report Functionality
- Aggregation and visualization. The report compiles data from all runs within a RunGroup into interactive charts, including pass/fail rates, execution times, coverage metrics, and timelines. For example, it supports pagination (e.g., 50 runs per page) for large datasets, with options to navigate historical results and compare parameters like flaky tests, degraded performance, or reviewed cases.
- Customization. Users can tailor AI Reports with the follow-up prompts according to their purposes. These results are saved as an insight, in case you want to compare output results later.
- Collaboration. Provides stakeholder-ready visuals, for Devs/QA, supporting the “Three Amigos” approach.
- View Combined Reporting. Access the “Combined Report” button within a Rungroup to generate a holistic summary without merging individual run results into one—preserving granularity while offering cross-run insights. There are filters and comparison tools so you can change which run is the “baseline” or main run for comparison, and inspect how test outcomes have shifted over time.
- Integration and Sharing. AI reports seamlessly tie into Testomat.io’s ecosystem, including Jira for traceability, defect management and CI\CD tools. Reports can be exported as PDF/XLSX, shared via public links, or pinned to the dashboard for quick access.
Rungroup Statistic Report elevates Testomat.io from basic reporting to intelligent analytics, turning scattered run data into actionable insights. It is ideal for modern Agile teams to track sprint progress.