





Reports in Jira turn raw issue data into numbers a team can act on. They cover sprint progress, workload and release readiness, and most of them take three clicks to open. Jira reporting provides diverse information that allows users to analyze data about project issues, team productivity, project progress, and other critical aspects. Users have access to built-in Jira reports, third-party tools for report generation, and customizable report dashboards. This flexibility meets the needs of any team, regardless of its goals or project scale.
Also check out related topics:
How to create reports in Jira?
To create a report in Jira, open your project, click Reports in the left sidebar, choose a report type and set the filters you need. The report builds from the issues already in the project, so no extra configuration is required for the built-in set. Jira reports are available to Jira Data Center, Jira Server, and Jira Cloud users for managing their projects. Such diversity is beneficial for teams. Do you agree? Moreover, generating built-in Jira reports is easy.
- Built-in reports. Agile, issue analysis and forecast reports that ship with every project.
- A Jira reporting dashboard. Gadgets you place on a dashboard to watch several metrics at once.
- Apps from the Marketplace. Third-party tools for custom reports, and test management plugins such as Testomat.io for QA data that Jira issues never hold.
Jira create report: three steps to any built-in report
To generate built-in Jira reports, follow these steps:
- Select the project you’re interested in.
- Click the Reports button.
- Navigate to the specific report and start working.
Creating reports in Jira takes the same path in every deployment, so a team that moves from Server to Cloud keeps the habit. The Jira create report flow stays identical for every built-in report, and only the filters change.
See more about Jira integration with Testomat.io test management in this video: Jira integration tutorial
⬇️ Now, let’s look in more detail at the wide range of reports offered by this popular project management system.
Jira reports tutorial: types of built-in Jira Agile reports
Jira software offers different types of built-in reports that you can generate without additional configurations or installations. These reports can be grouped into the next main categories:
- Agile reports. Here the Cumulative Flow Diagram & Control Chart reports belong.
- DevOps. It provides insights into the performance of software delivery pipelines, tracking metrics that reflect the effectiveness of DevOps processes.
- Issue Analysis Reports. These reports help project teams manage project issues effectively.
- Forecast and Management Reports. These simplify workflow management by allowing you to monitor workload, team progress, etc.
A variety of Jira reports on my project look like:
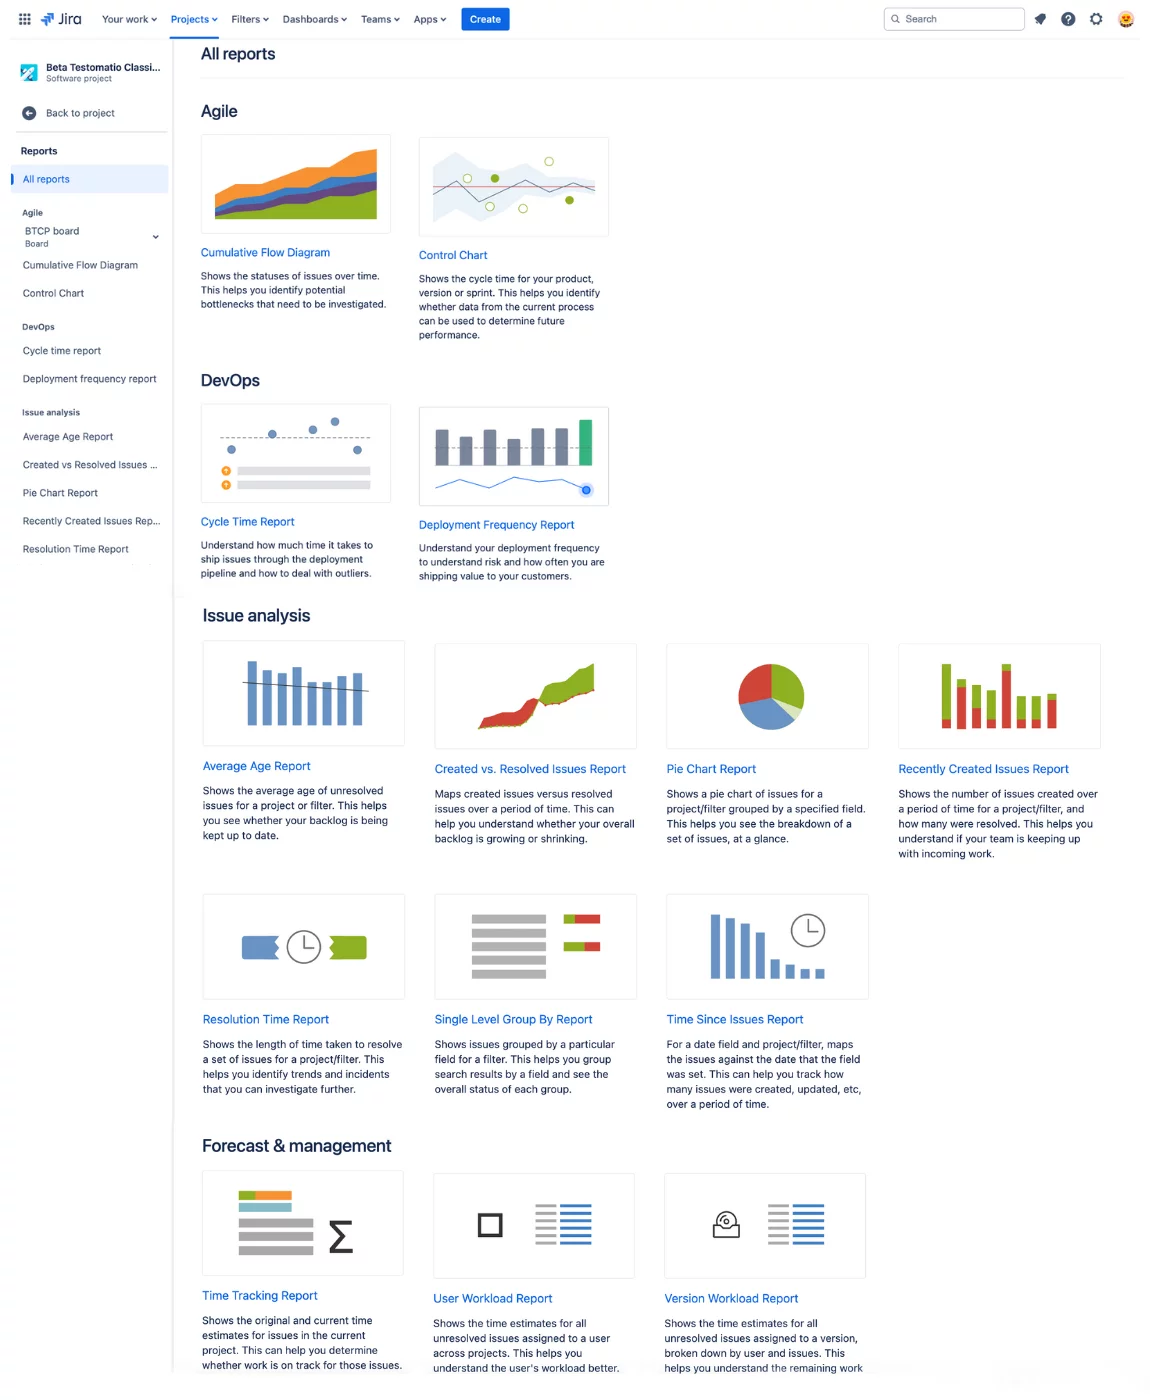
Below, we list the standard Jira reports and explain how to generate them, helping you understand how they can assist in your specific needs.
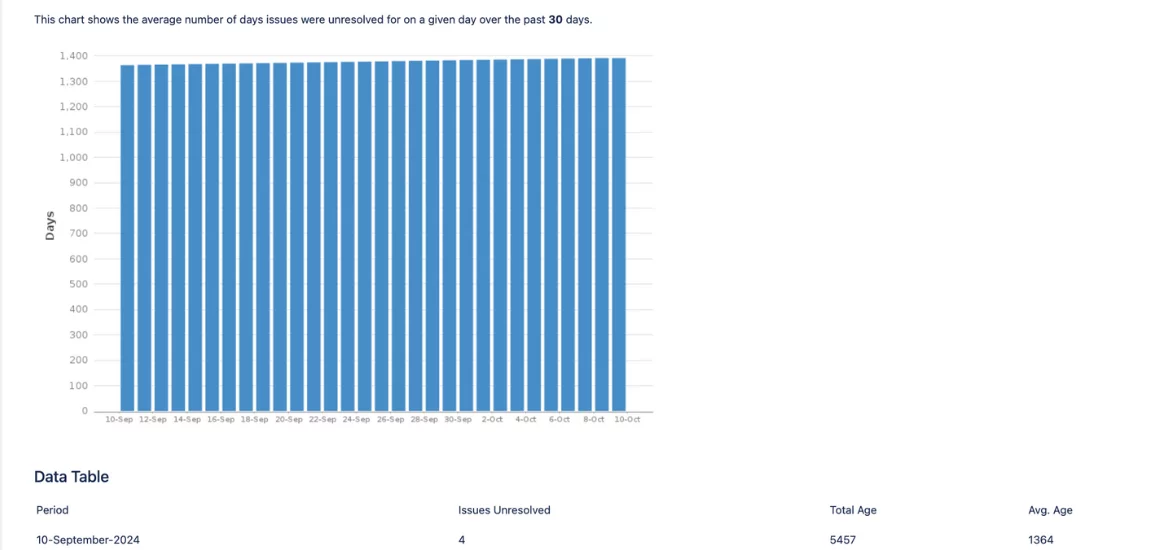
Average Age Report
Average Age Report is one of the Jira custom reports that your team definitely needs. This report tracks how long open issues remain unresolved in a project. It helps the team ensure the backlog is up to date. Additionally, this report can be used to predict the resolution time of specific issues, identify bottlenecks in product development, and determine team members with lower productivity.
Custom Jira reports: Created VS Resolved Issues Report
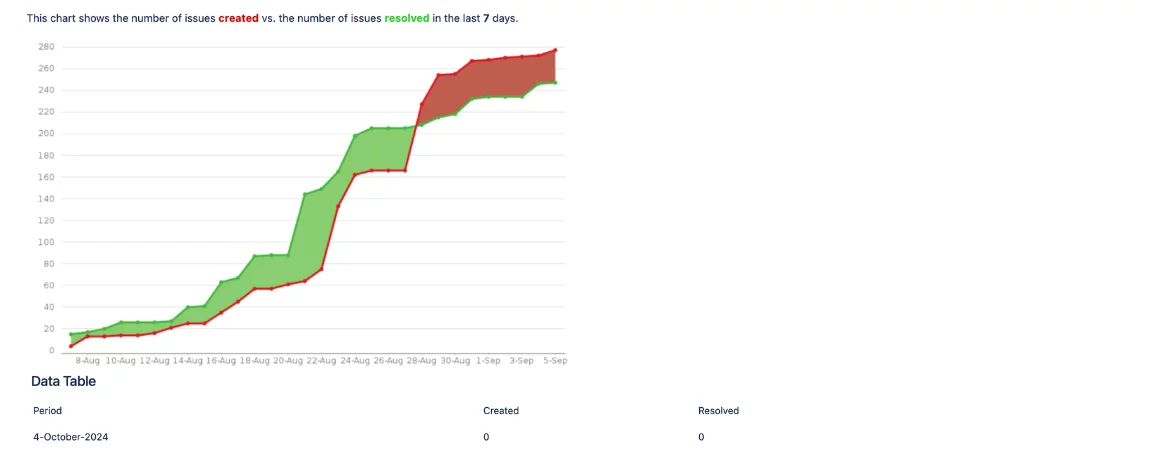
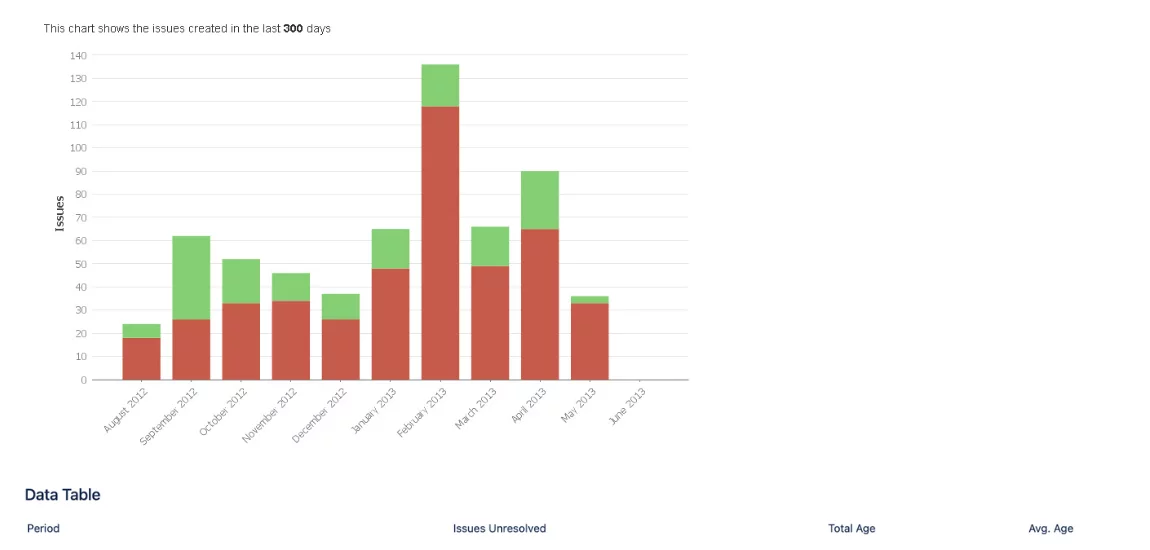
This report compares the number of created and resolved issues over a specified period. It helps monitor the size of the product backlog. The report is presented as a chart, with red indicating periods where the number of created issues exceeds the resolved ones. If resolved issues dominate, the area is shaded green.
Pie Chart Report
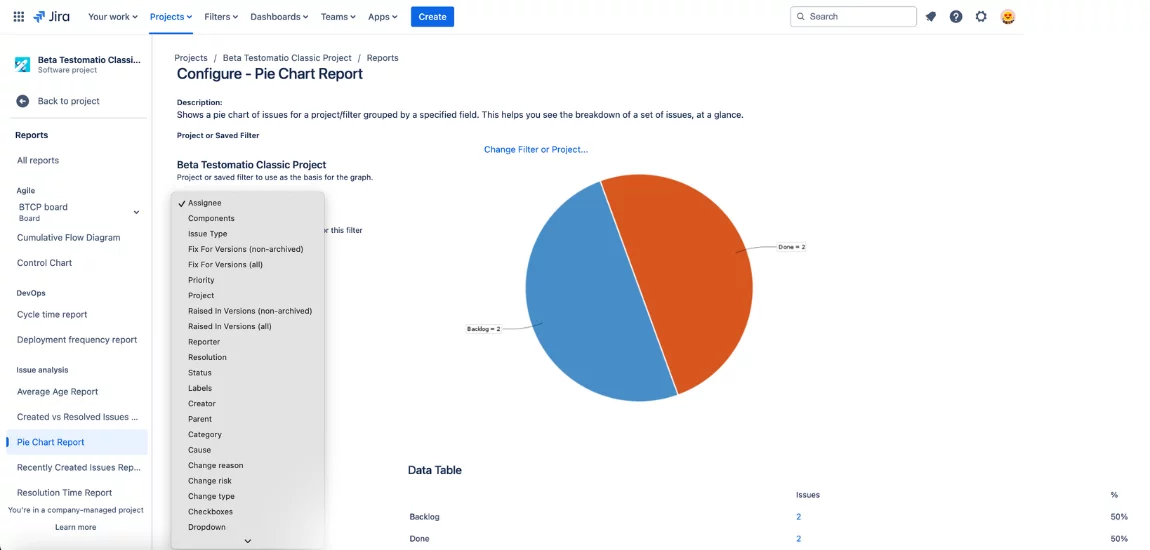
The Pie Chart Report is one of the brightest Jira reports examples. This report is a pie chart displaying all project issues grouped by a specific parameter. For example, you can view the status of tasks being worked on by a specific assignee. The visualization provides an overview of the project’s progress from a single view without the need to analyze large amounts of historical data.
Recently Created Issues Report
The Recently Created Issues Report is one of the Jira bug reports. By generating this report, you can track the number of recently created issues and the number of resolved issues for the same given time period. This information helps determine whether the team is managing existing tasks or if workload management optimization is needed.
Resolution Time Report
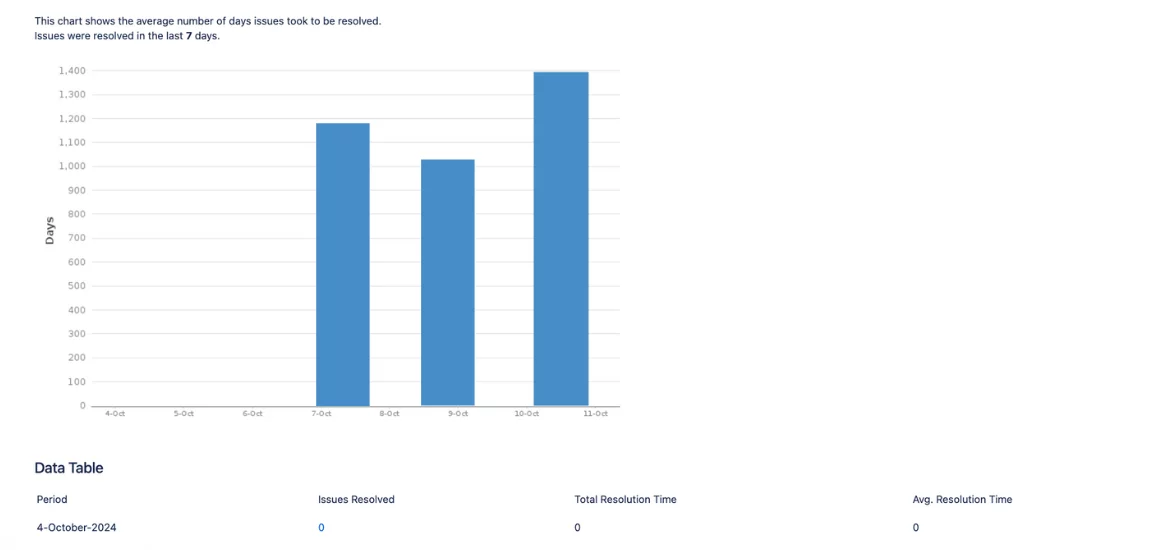
Resolution Time Report is an example of custom reports in Jira, too. These reports reflect how much time is required to resolve a specific set of issues. You can view the results for the entire project or filter by issue type and focus on selected Jira data. This helps accurately predict project timelines and adhere to projected release dates.
Single Level Group By Report
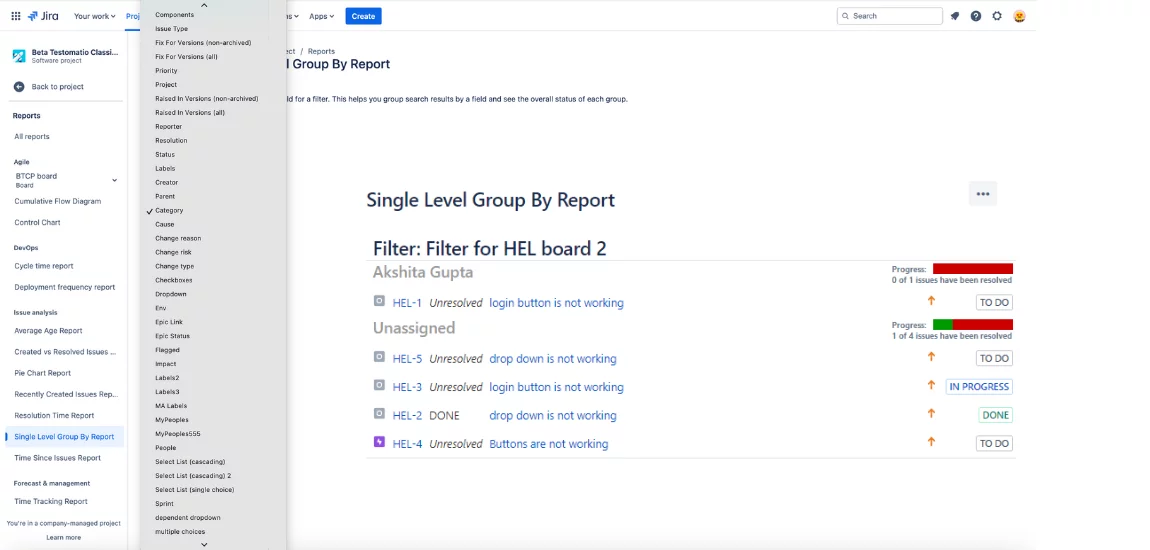
Single Level Group By Report is one more example of a useful Jira software report. This report allows you to group all project issues by a specific parameter and view the results for each group. For example, you can create reports based on issues assigned to a particular assignee or those in a specific status.
Time Since Issues Report
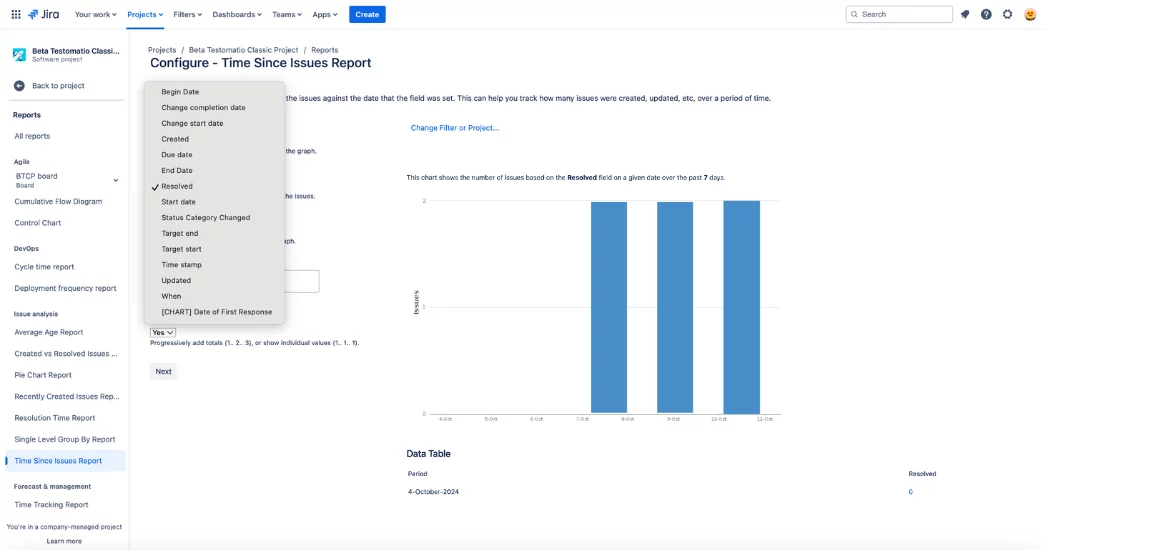
This report allows tracking the time spent on resolving an issue within a particular project version.
The report visualizes time tracking results using a bar chart. One bar, the progress bar, shows the ratio of resolved to unresolved issues. The second one, the accuracy bar, displays how closely the original estimate matches the current result.
For effective time tracking, this representative of reports in Jira includes four custom fields:
- Original Estimate. The time planned to complete the issue.
- Estimated Remaining Time. The estimated period the team expects to complete the assigned tasks.
- Time Spent. The time the team has already spent on resolving the issue.
- Accuracy. The difference between the planned completion time and the actual result.
These were reports for issue analysis, now let’s move to management reports that help organize work on a project.
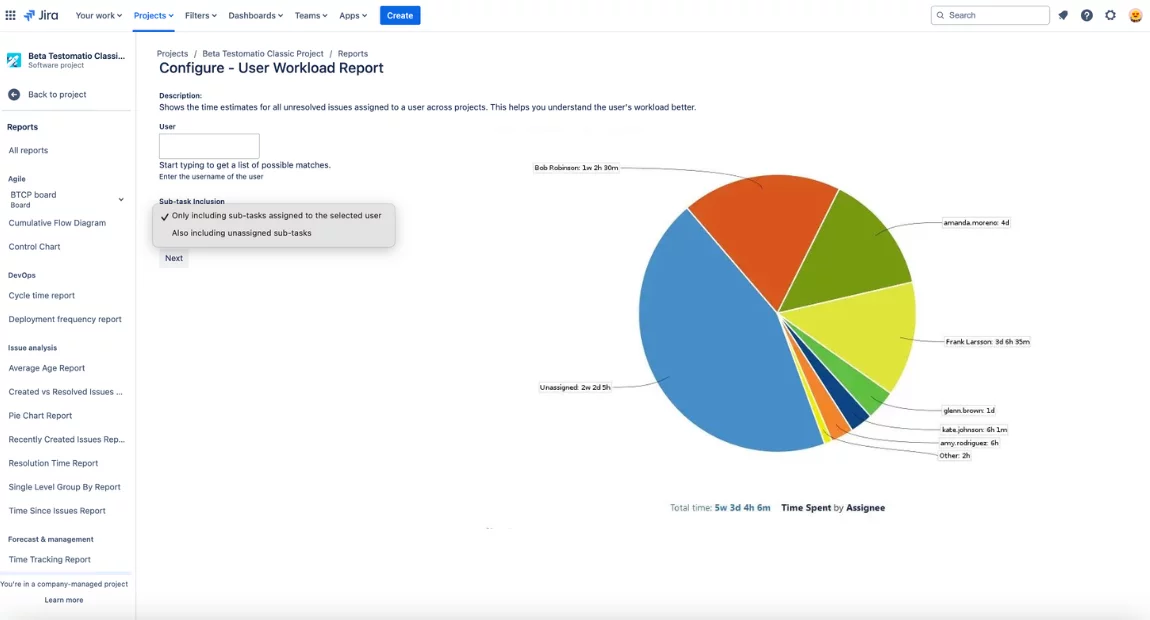
Users Workload Report
To see the workload assigned to a specific user, you need to generate the users’ workload report. It also shows how many unresolved issues remain with this employee and how much time they need to complete them.
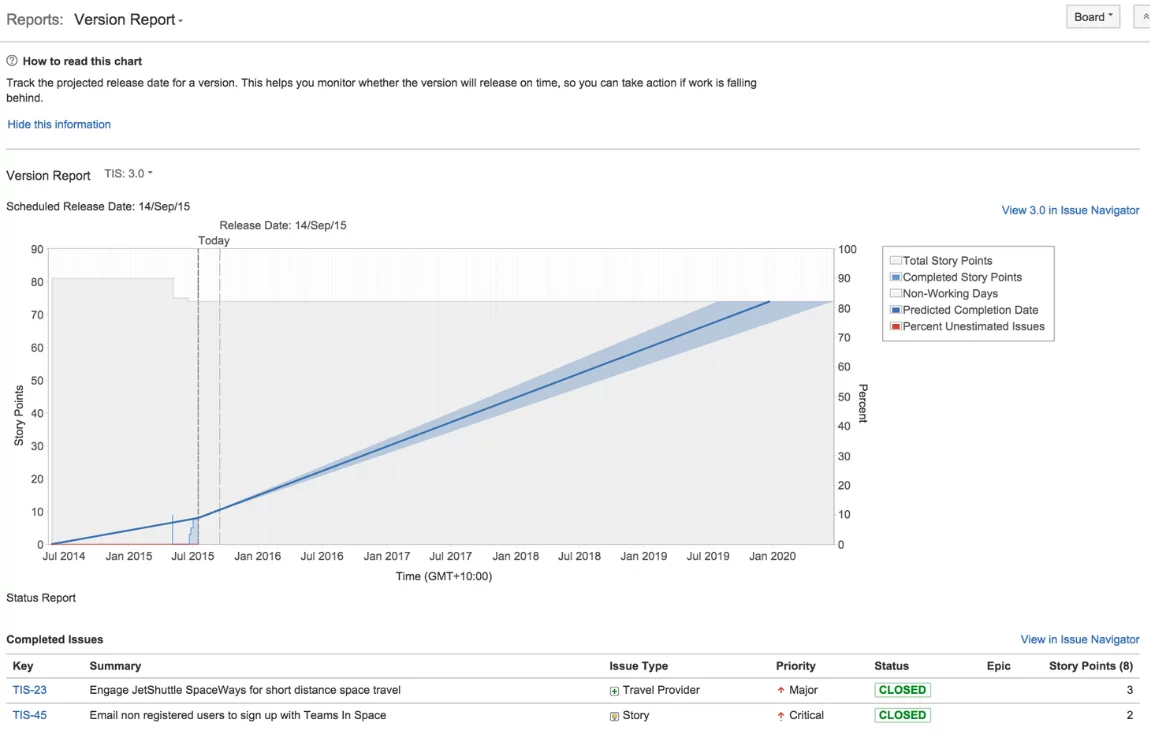
Jira version report examples: Version Time Tracking Report
This Jira version report shows the progress of work needed to complete a given version. Work logs and time estimates are used for report generation, so a release manager sees whether the remaining effort still fits the release date.
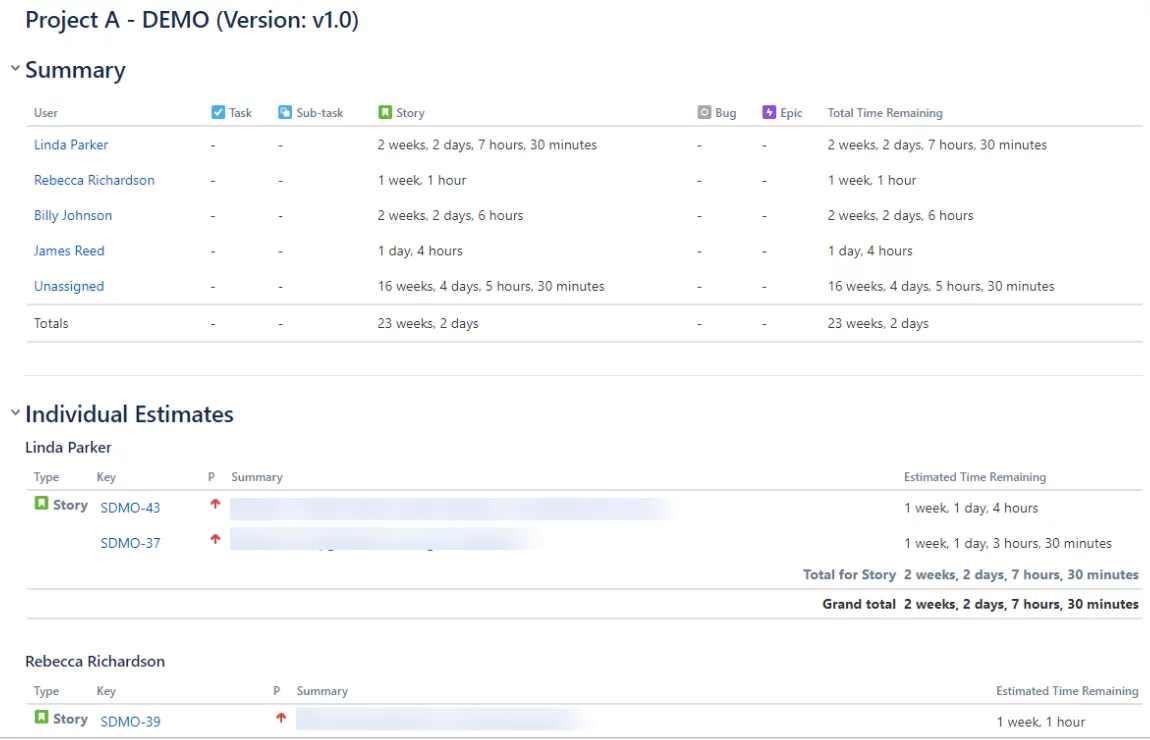
Version Workload Report
This report provides information on the workload needed to complete the version. All tasks can be grouped by a specific issue or user, displaying each employee’s workload and the total number of unresolved issues for the given version. Read together with the Version Time Tracking Report, it answers who carries the remaining scope of the release.
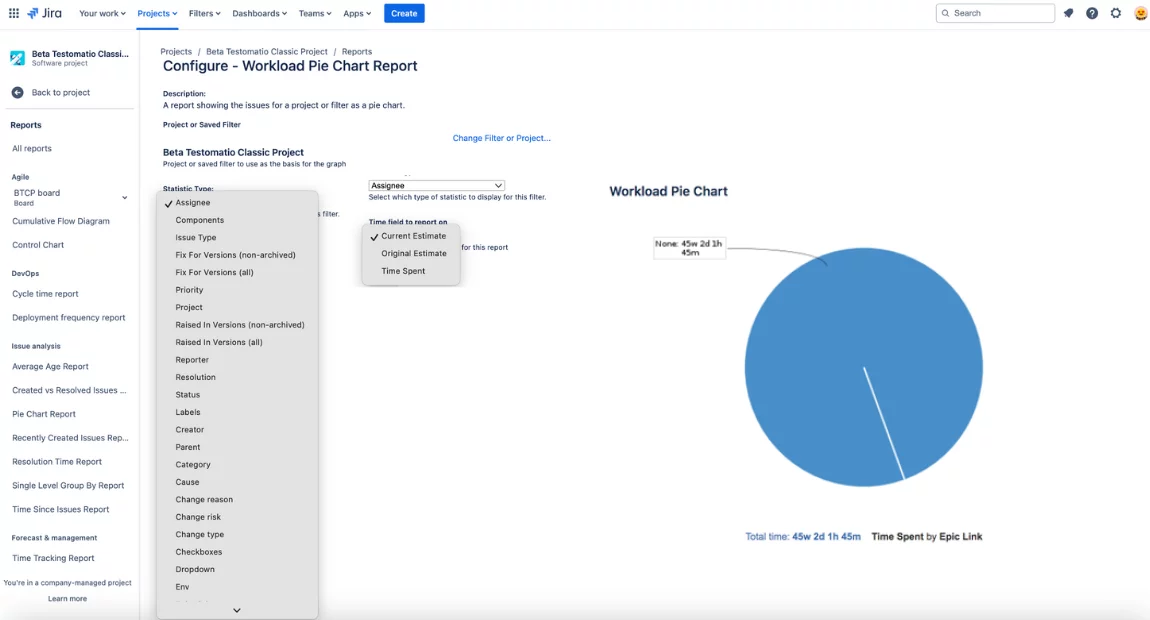
Workload Pie Chart Report
Workload Pie Chart Report is one of the Jira Service Management reports. This report displays the workload of all users within a specific project. Filters can also be applied to view only the data you are interested in.
Time Tracking Report
This report is highly flexible, since users can customize time tracking parameters as needed. It displays original and current time estimates and helps plan the project’s work efficiently. For the team’s convenience, all data is presented in a chart showing planned, remaining, and spent time.
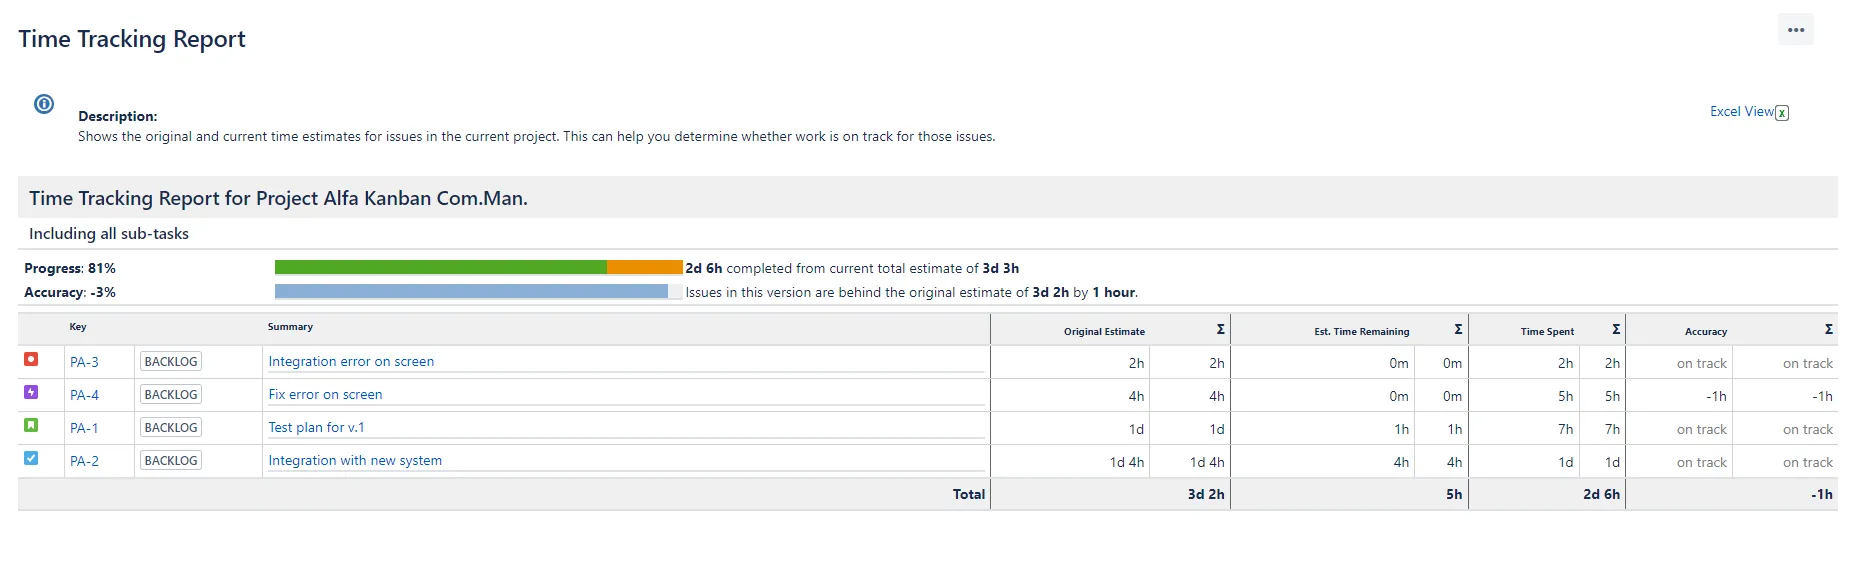
🔴 Note: To access this report, make sure the administrator has enabled time tracking.
Optimizing development with Agile reports (Jira)
A separate category of Jira reports is specifically designed for teams practicing Agile methodologies. Let’s take a closer look at them.
These reports help Agile teams answer key questions on their path to achieving goals:
- How much work is being completed per sprint?
- How efficient is our workflow planning?
- Are we getting closer to achieving the sprint goal?
- Are enough issues being processed in each sprint?
- How long does it take my team to deliver value?
- Is our project management effective?
- What are our potential bottlenecks?
- etc.
Agile Jira reports and dashboards include Jira sprint reports and others:
- Scrum Board. This tool offers reports for Scrum teams. Developers working in iterations (sprints) can easily create and view reporting, with the ability to track one or multiple Jira projects.
- Kanban Board. This tool is for Kanban teams focused on workflow transparency and evenly distributing workloads among team members. It also allows you to monitor multiple software projects and manage reports effortlessly.
- Control Chart. Displays two key metrics. Cycle time is the total time spent on an issue, including time to complete and any rework after reopening the issue. Lead time is the time from issue creation to its completion. The report can be generated for the entire project, a specific version, or sprint.
- Cumulative Flow Diagrams. These diagrams visually show unresolved issues for a project, version, or sprint.
- Burndown Chart. Compares the planned amount of work to the actual resolved issues during the current sprint.
- Sprint Report. This report contains a list of Jira issues for a specific sprint. It’s helpful to generate this report before a retrospective for in-depth analysis of results. It also helps track project progress when the sprint is still ongoing.
- Velocity Chart. This chart displays the team’s velocity, or in other words, the team’s productivity during a sprint, the value they can deliver in one iteration. By calculating velocity over time, you can predict future performance and determine how much work is realistic for your team.
In addition to standard reports, Jira offers other features that simplify data analysis on a project.
Jira reporting dashboard: gadgets available out of the box
Jira provides dashboards where various gadgets can be placed to help monitor key project metrics. A Jira reporting dashboard collects several gadgets on one screen, so progress and open issues stay visible without opening each report.
Here’s a list of the most helpful and frequently used pre-installed gadgets:
- Activity Stream Gadget. Displays details of your recent activity.
- Assigned to Me. A gadget that gives access to all issues and projects assigned to a specific user.
- Calendar. Shows all versions and Jira issues in a calendar format.
- Heat Map. Displays the relative importance of issues retrieved from a relevant project or based on a specified filter.
- Road Map. Aggregates information about all planned versions and the progress of tasks needed to complete them.
- Time Since Chart. A bar chart that visualizes information about all issues that have been recently updated, such as changes in status to Created, Resolved, Updated, etc.
- Sprint Burndown Gadget. A convenient line chart that shows project progress, the amount of work completed during a specific sprint.
- Average Age Chart. Like the corresponding report, this gadget displays the period issues remain unresolved. Data is shown in a histogram format.
- Average Time in Status. Unlike the previous one, this gadget allows you to track the time issues spend in any status.
- Issues in Progress. Gathers information about all issues that a specific user is working on during a given period.
Since all of the above Jira gadgets are pre-installed, no additional configuration is required for their use. All you need to do is follow three simple steps:
- Select the desired Jira dashboard and click the “Edit” menu.
- Click the “Add Gadget” link.
- Find the gadgets you want to add to your Jira dashboards.
If your gadget search doesn’t yield the desired results, you can create custom gadgets that fully meet your team’s reporting needs.
Jira automated reports: send results without opening Jira
Jira automated reports save the step of checking a dashboard by hand. Two mechanisms cover most cases. A filter subscription mails the results of a saved JQL filter to a person or a group on the schedule you set. Automation rules react to events in the project, so a rule can post a summary to a chat channel when a sprint closes or when a release version is completed.
For QA data, automation starts one level earlier. Test results arrive from the CI pipeline, and a test management platform such as Testomat.io pushes the run status back into the linked Jira issues, which keeps release reports current without manual updates.
Jira create custom report: third-party tools that extend Jira
In addition to developing custom gadgets, you have another option to extend Jira’s reporting capabilities by installing third-party external reporting tools created by external developers.
Here’s a list of the most popular tools used by Agile teams:
Arsenale Dataplane Jira dashboard reports

This intuitive and powerful plugin allows corporate teams to generate comprehensive reports. It offers customizable reporting, data visualization with charts, adding reports to dashboards as gadgets, and more. You can easily share reports with colleagues via Confluence or export results to PDF, XLS, and CSV files.
eazyBI Reports and Charts for Jira

One of the most popular third-party reporting apps for Jira, it allows teams to visualize data through heat maps, graphs, tables, charts, and trendlines. With eazyBI, you can integrate data from Jira and other apps used in the project and accumulate them on interactive dashboards. The tool also enables data analysis through filters, exploring details, and highlighting the necessary areas.
Timesheets by Tempo: Jira time tracking
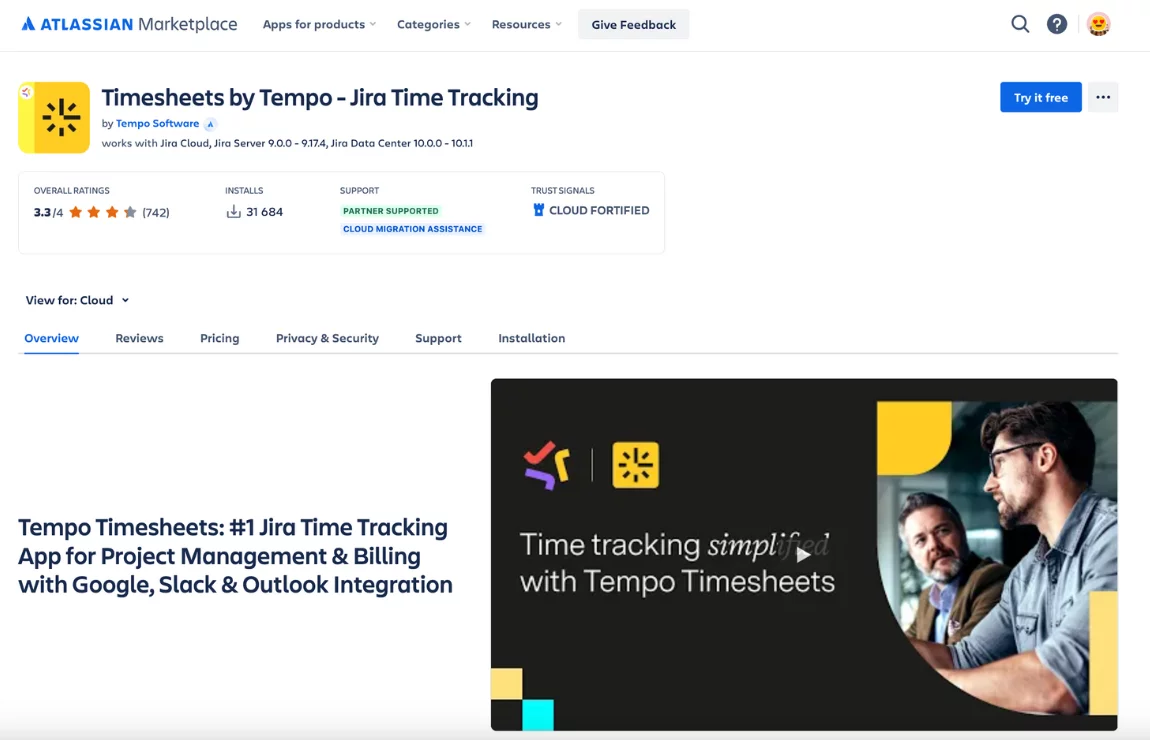
This AI-based time tracking app automates tasks, reducing time consumption and simplifying workload management. The timesheet report allows monitoring time and expenses by project, client, or team member. The app provides real-time insights, making resource planning and expense control easier.
Time Tracking and Billing Reporting
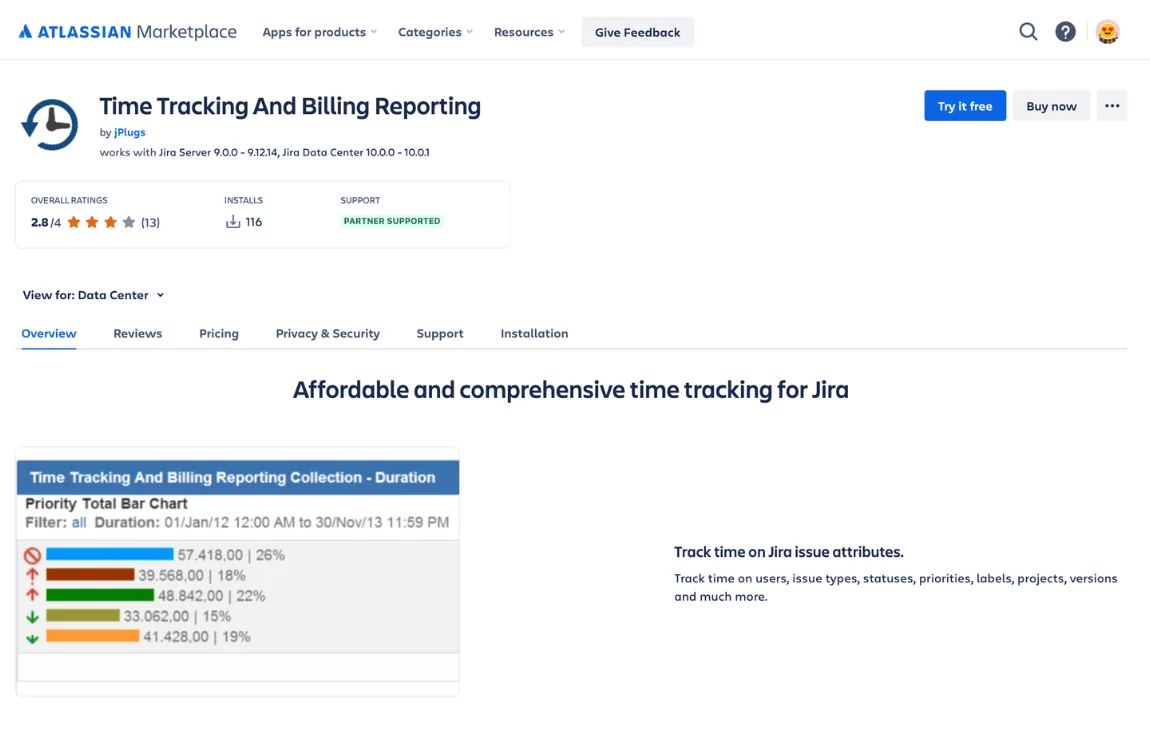
Another tool that simplifies time tracking on a project. It helps you track your working hours and those of your team members. The plugin also allows you to monitor and plan expenses. Use ready-made templates, view charts, filter data by various parameters, and add gadgets to dashboards. These features significantly streamline the workflow.
Report Builder by Actonic Products GmbH
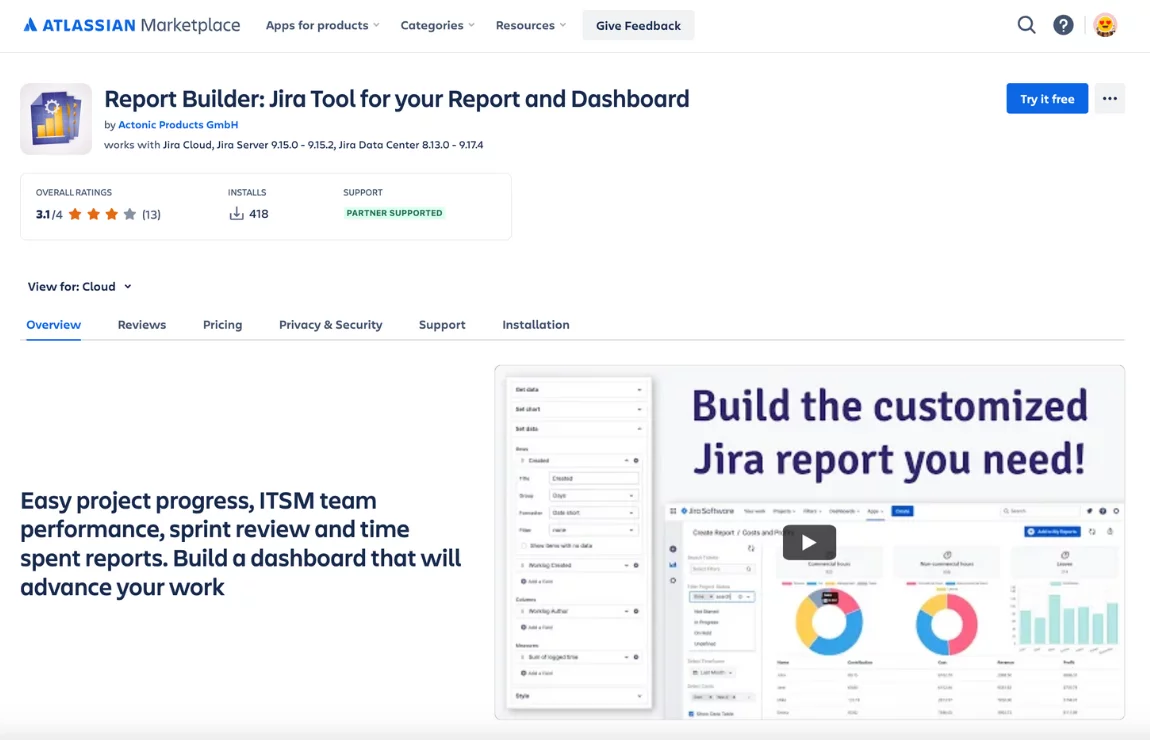
This plugin enables the creation of custom reports that cover all the key aspects of project work. It allows you to track project progress, time spent, and team productivity. You can also use templates for Jira issue analysis reports to create reports tailored to your project’s needs. With its visualization capabilities and intuitive interface, the tool is helpful for business process management.
All the above-mentioned reports easily integrate with Jira’s issue-tracking system, greatly expanding its capabilities. When you need a Jira create custom report scenario that the built-in set does not cover, these apps let you shape the data, automate delivery and share results with stakeholders.
The value of Jira Cloud reports for a delivery team
Jira stores vast amounts of data across various projects. The ability to properly analyze and manage this data enables teams to achieve impressive results. This is made possible through Jira reports, which offer several benefits:
- Objective Project Evaluation. With Jira reporting, you can evaluate different aspects of project work. These include the quality of issue resolution, team productivity, sprint details, project progress, and more. The wide range of available data allows you to identify meaningful trends and patterns, using them to improve project management in the future.
- Making Effective Data-Driven Decisions. Thanks to extensive data and deep analytics capabilities, you can make well-informed decisions based on historical data. Jira reports provide a reliable foundation for forecasting future sprints, including estimating the necessary period of time, projected expenses, and user workload. Access to large datasets also helps you pinpoint bottlenecks and work on resolving them.
- Better Team Collaboration. Jira reports have a clear format and offer visualization options. This makes it possible for all team members, including non-technical specialists, to fully participate in the development process. Close collaboration allows for more effective problem-solving, the implementation of innovative solutions, and faster releases of high-quality software products.
- Transparency in Work Processes. With Jira reports, all users can track their workload and monitor assigned tasks. By reviewing reports, everyone clearly understands their roles and responsibilities and is aware of both personal and team deadlines.
- Improved Efficiency. Among other things, Jira reporting helps identify the areas of a project that consume the most time. Determine the causes of delays and work on consistently improving your productivity. Over time, this will positively impact the overall efficiency of the entire team.
Jira reporting for test management
Jira is already widely used for project management and issue tracking. QA teams are looking for Jira plugins for test management, to link requirements with their tests with them. It provides a holistic view of the development of the project and makes it easier to track its progress.
Popular Jira test management plugins include Xray, Zephyr, TestRail and TestFLO. Each offers specific features to enhance testing workflows. The Testomat.io Jira Plugin is a modern alternative.
Testomat.io test management Jira Plugin benefits
- Customizable Workflows. Our test management plugins allow the creation of customized workflows for test management, enabling teams to tailor the process according to their specific needs.
- Automation Support. Integration with popular test automation frameworks, enabling automated test execution results to be logged and tracked in Jira, streamlining continuous integration and DevOps processes.
- Real-time Collaboration. Updates on test statuses, bug reporting, and test execution are being reflected instantly within the Jira bidirectional integration. Plugin supports BDD as well.
- Real-time Test Reporting. Jira plugin offers powerful reporting capabilities, allowing users to generate reports on test execution, defects, coverage, and more. This helps in tracking quality metrics efficiently.
It is best for teams using both automated and manual testing, including DevOps or CI\CD setups. Advanced reporting and integration with numerous other tools make it ideal for complex test environments. The fit does not depend on the size of your team or on whether you prioritize manual testing or a mix of manual and automated testing.
👀 Let’s have a look now in more detail:
Advanced Analytics Dashboard with a wide set of metrics is crucial for a test management system because it provides real-time visibility of test progress and quality, helping teams make informed decisions about release readiness while optimizing the testing process. Among the Testomat.io widgets key is the Jira Statistic Report. It showcases statistics of tests linked to requirements.
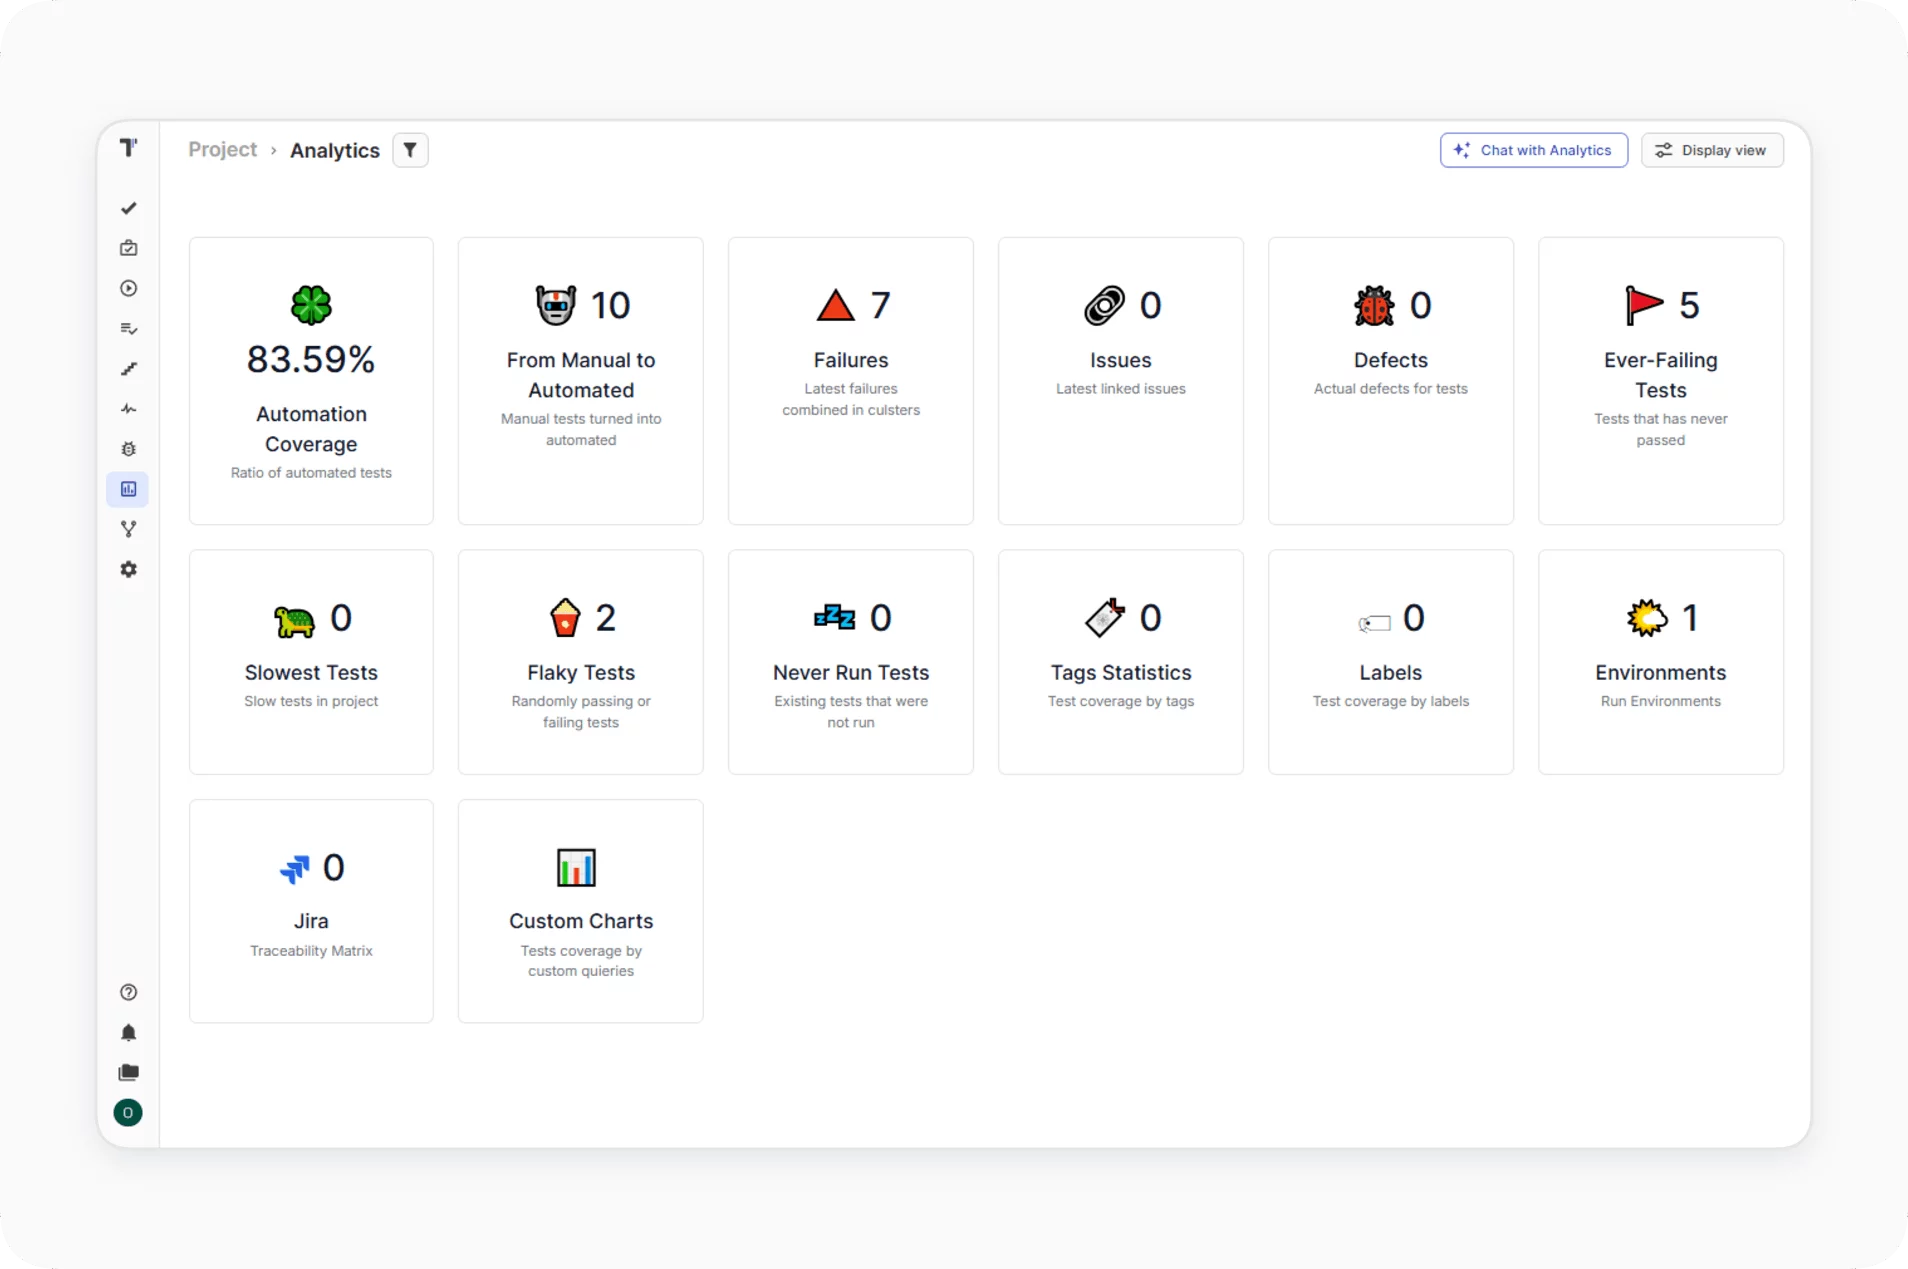
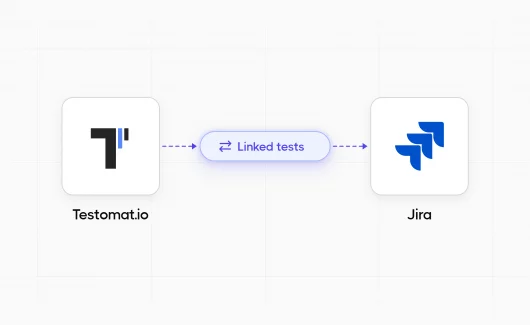
You can easily track how each requirement is linked to tests, including which tests are planned, executed, their frequency, and status results. A filter with advanced settings helps you quickly find specific tests or requirements. The Jira Plugin is bidirectional, allowing you to click on a requirement and be directed to Jira, similarly, user stories added in Jira automatically appear in the test management system.
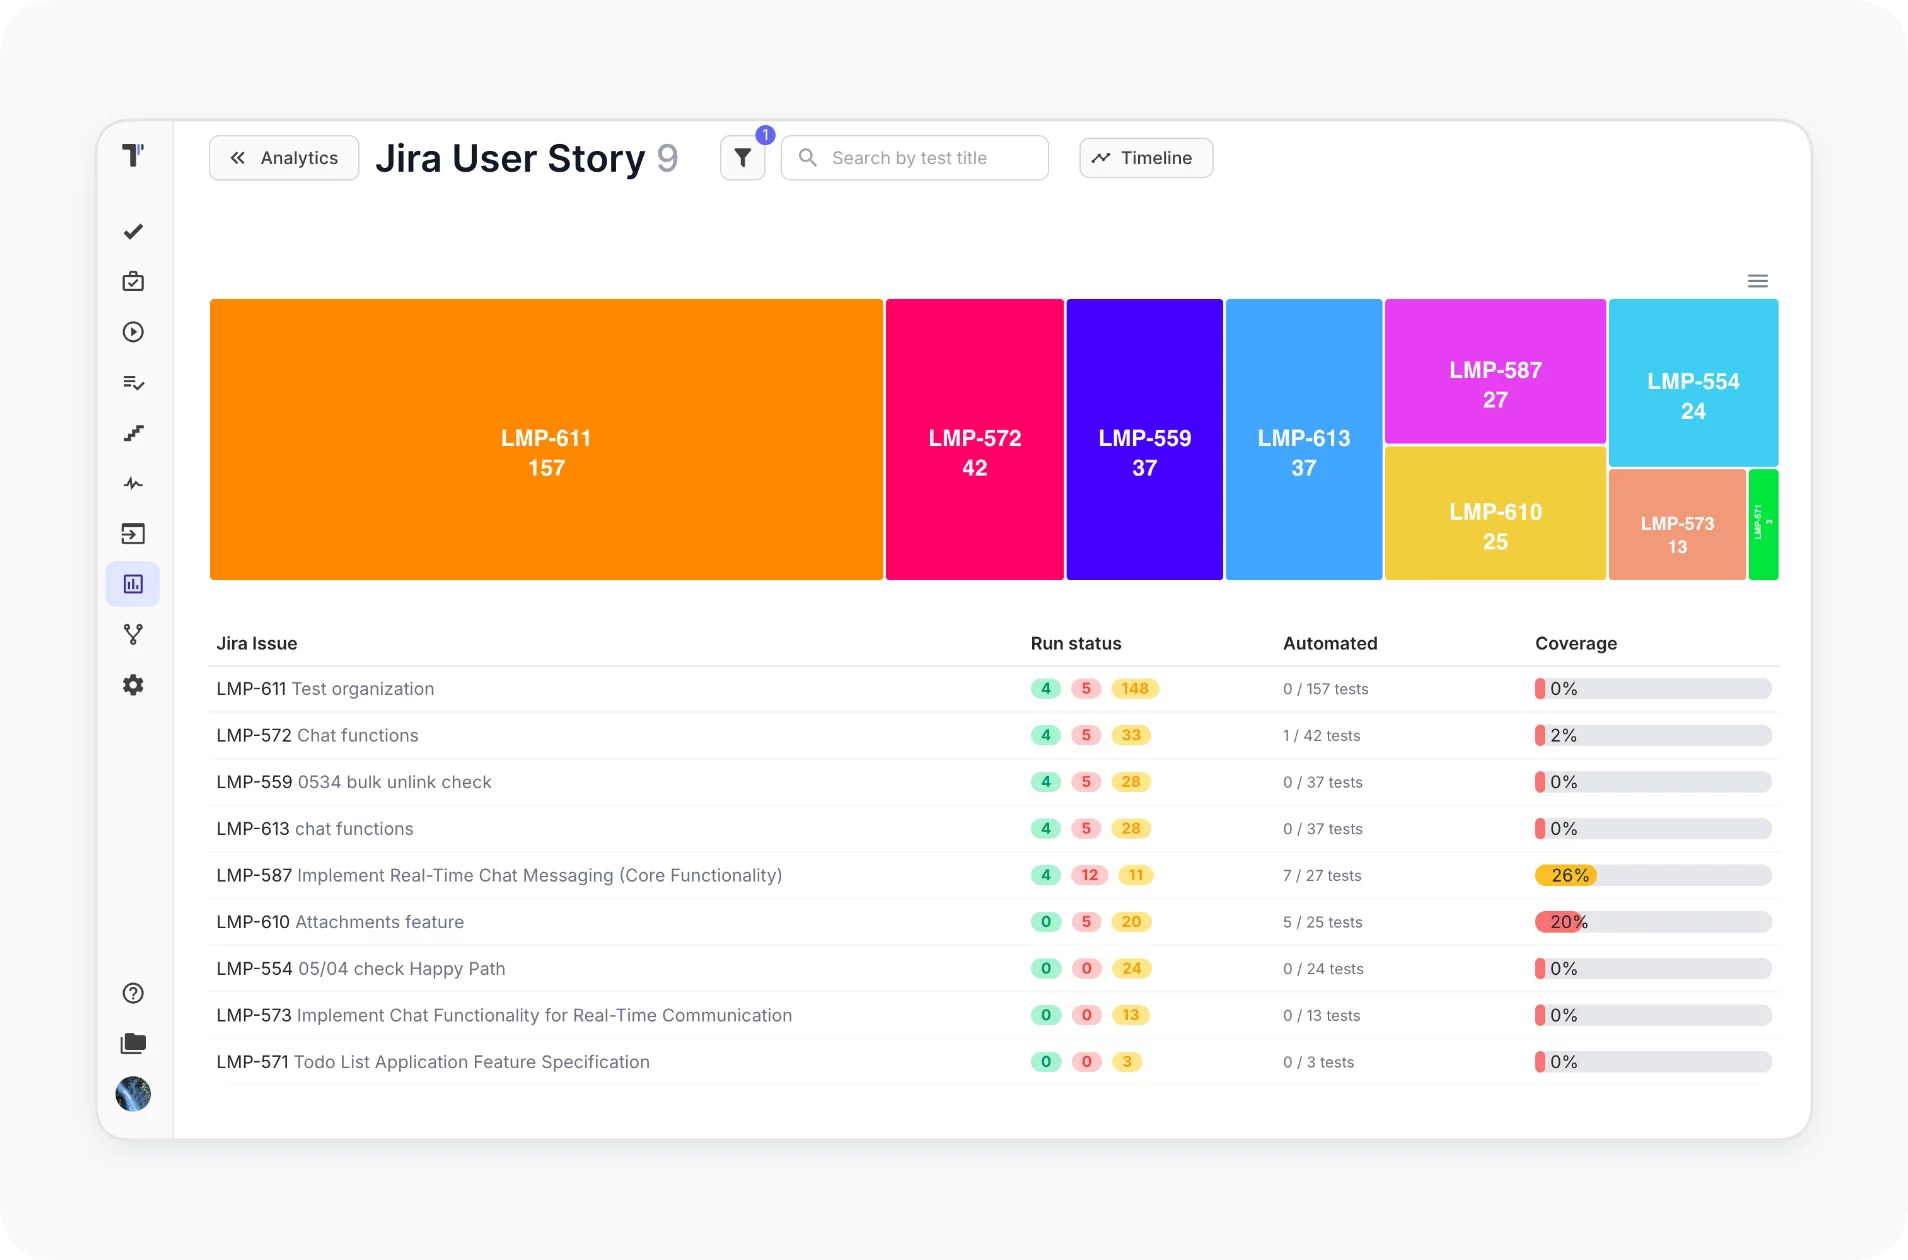
You can track a full list of tests linked to one user story and check its status accordingly. Jira Plugin allows sync automated tests as well. So, the role of TCMS is one source of truth for manual, automated testing and requirements. Building one complicated report is easy. Status of particular test Run of specific requirement card on the test management system. List User Stories in the Jira Plugin. Advanced filters with TQL are available as well to find needed requirements quickly.
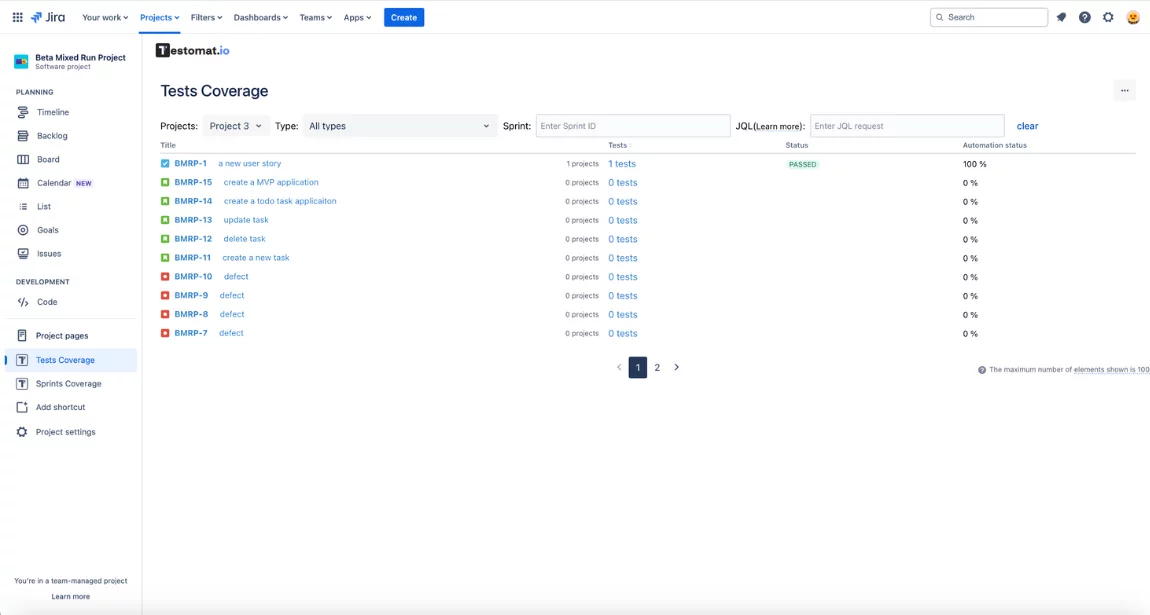
The highlight is that you can execute tests directly with Jira, without switching to the test management system, even on CI\CD pipelines. This feature makes it easy to engage non-technical team members like Project Managers (PM) and Business Analysts (BA) in the testing process, streamlining collaboration across the Agile team.
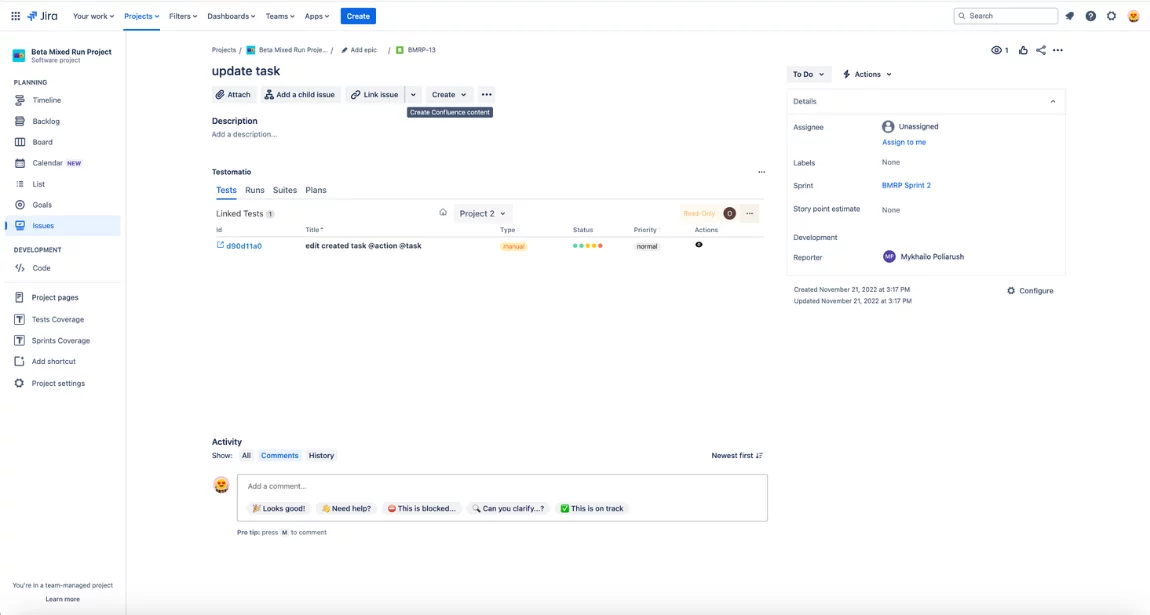
As you can see, the Testomat.io Jira Plugin is a robust Jira test reporting tool designed for QA engineers. It ensures quick data processing compared with competitors. Test execution status notifications are mainly automated, which makes testing more efficient, and test automation engineers get the reports they need without extra work.
Bottom line
Reports in Jira are an essential feature of the project management system. They allow teams to create custom reports at individual, team, project, and multi-project levels. With their help, you can gather data on various aspects of the development process, from issue analysis to expense management.
The versatility of Jira reporting is key to solving emerging problems and better forecasting future activities. Now you know how to create reports in Jira for sprints and releases. Start with the built-in set, add a Jira reporting dashboard for daily monitoring, and connect a test management plugin when release decisions depend on test results.