




Your team runs the regression suite every night, and the same build passes on Monday and fails on Wednesday. Now you need to decide if the product is unreliable or if the tests are. According to the Uptime Institute Annual Outage Analysis 2026, 57% of operators said their most recent major outage cost more than $100,000. In this guide, you’ll learn how reliability testing works and how to trust its results before a release.
What Is Reliability Testing?
Reliability testing checks if software performs consistently and without failures over a specified period under expected conditions. It measures how often failures happen and how fast the system recovers. The primary goal is reliable software that works the same way on day 1 and on day 30.
The ISO/IEC 25010:2023 product quality model describes reliability as the ability of a system to perform its functions under set conditions for a set period of time. The standard divides reliability into faultlessness and availability, plus fault tolerance and recoverability. Reliability testing evaluates these qualities with numbers, for example 99.9% availability over 30 days. A test plan can cover various aspects of reliability, so teams usually pick the qualities that matter most for their software system.
Reliability testing in software testing belongs to non-functional testing. Functional tests check software design and functionality, so they show what the system does. Reliability tests check the system’s ability to function after hours or days of real use.
The same term also appears in hardware engineering and in psychology research. In hardware, product reliability testing includes life testing, where a device runs until it fails, and tests under various environmental conditions such as heat and humidity. Reliability engineering applies the same ideas to software or systems that combine code and hardware. This guide covers software reliability testing for QA teams.
Reliability Testing vs Performance Testing
Teams often confuse reliability and performance testing, because both use load and both run on a staging environment. The difference is the main question each test answers:
| Area | Performance Testing | Reliability Testing |
|---|---|---|
| Main question | How fast is the system under load right now? | How long does the system work correctly? |
| Example duration | 1 hour | 14 days |
| Main metrics | Response time and throughput | MTBF and availability |
| Example result | p95 response time of 800 ms at 1,000 users | 99.9% availability over 30 days |
Performance testing shows the performance of software at a single point in time. A reliability test shows how that performance changes over days. A performance test can pass while the system slowly loses memory. A reliability test with the same load finds this defect after 20 hours, when the service crashes.
Why Reliability Testing Matters for QA Teams
Reliability testing helps you find defects that appear only after long use. Here’s why these defects need their own tests:
- They appear after a release. Real users work with the system for many hours, and defects such as memory leaks grow during this time.
- Short tests end too early. Functional tests and quick load tests finish before memory leaks or slow connection loss become visible.
- Users see them first. These defects cause slow pages and errors in daily work, so they affect the overall user experience.
- Outages are expensive. In the Uptime Institute survey, 1 in 5 operators reported that their most recent major outage cost more than $1 million. This result repeated for the second year in a row.
- Faster releases add more risk. The DORA 2025 State of AI-assisted Software Development report found that AI adoption links to higher software delivery throughput and also to higher delivery instability. Your team can release more code each week, so each release brings more change to test.
How to Benefit With Reliability Testing?
With reliability testing, each new release keeps the stability and dependability of the previous release. Here’s how reliability testing can help your team:
- Early detection of time-based defects, such as memory leaks and full log disks, before users notice them.
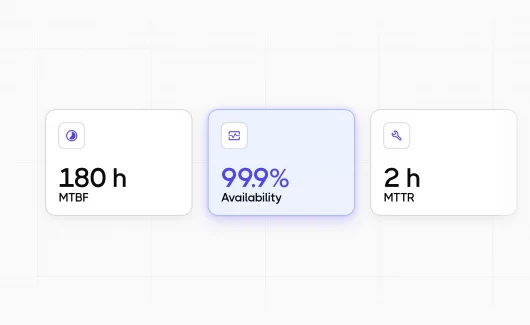
- A number for release decisions, for example MTBF of 180 hours.
- Checked recovery paths, so you know the system restarts correctly after a database or network failure.
- Lower repair cost, because identifying and fixing a defect in staging needs less work than an incident in production.
Objectives of Reliability Testing
The objectives of reliability testing connect test data with release decisions. Most teams set these goals:
- Identify failure modes. You learn how the software system fails and what causes each failure.
- Measure failures over time. Failure rate and MTBF show if the product becomes more or less stable.
- Estimate future reliability. Trend data helps you estimate how the next release will behave.
- Check changes or updates. A repeat run shows the effect of each code change on stability.
- Fix the causes of failures. Each fix should improve the reliability of the software before users see the defect.
Types of Reliability Testing
Teams use several reliability testing methods, and each type answers a different question. The commonly used methods below cover different risks. Most test plans combine at least two types, for example, an endurance test and a recovery test.
Feature Testing
Feature testing checks that software features work correctly and give the same result every time. You design test cases for every operation and run each one at least once. Then you check how operations work together. For example, a banking app runs a transfer 500 times in a row and compares every account balance with the expected value.
Regression Testing
Regression testing checks that old functions work correctly after changes are made to the code. In reliability work, you repeat the regression suite on every build. Comparing the results with previous builds shows the trend. If build 214 has 3 failures and build 215 has 11 with the same number of test cases, the new change probably reduced reliability.
Load Testing
Load testing checks how the system works under expected peak traffic for a long period. Tools such as k6 and JMeter simulate this traffic with virtual users. A typical reliability load test keeps 1,500 users active on a web store for 2 hours. You can read more about load and stress scenarios in our guide to types of performance testing.
Stress Testing
Stress testing pushes the system above its normal limits to identify the maximum load it can handle and learn how it fails. For reliability, the most important part is what happens after the stress stops. A good result shows that the system returns to normal response times within 5 minutes after traffic drops.
Endurance Testing
Endurance testing, also called soak testing, keeps a normal load on the system for a long period, for example 48 hours. This test is used to identify defects that grow slowly, such as memory leaks and connection pool exhaustion. For example, a service that uses 2 GB of memory at the start and 7 GB after 24 hours has a leak.
Recovery Testing
Recovery testing is used to test how fast the system restores work after a failure. You can stop a database node or restart a service during a test and measure the time until users can work again. If your target is recovery in under 60 seconds, the test gives a clear pass or fail result.
Environmental Testing
For software, environmental testing checks the software under different conditions, for example an Android phone with 2 GB of RAM or a slow 3G connection. You run the same set of tests on each configuration and compare failure rates. A large gap between two configurations shows where users will meet the most failures.
Fault Injection and Chaos Testing
Fault injection adds errors to the system on purpose. This simulation covers events such as network delay or a crashed container. Chaos testing uses the same idea in controlled experiments on staging or production. Netflix made this approach popular with Chaos Monkey, a tool that stops random server instances. Our article on chaos testing techniques explains how to plan these experiments.
Failure Mode Analysis
Failure mode software testing starts before the first run. The team lists potential failure points, such as a payment gateway timeout or a full disk, and describes the effect of each failure on users. Many teams use FMEA (failure mode and effects analysis), a method from reliability engineering, for this list. You can then design tests that simulate real usage to identify potential failures at each point.
Which Reliability Testing Metrics Should You Track?
The core reliability testing metrics are MTBF and MTTR, which together give you availability. Failure rate and POFOD add detail for systems with constant traffic or on-demand functions.
Each metric answers a separate question about failures. Together, they describe the reliability of software in a form the whole team can compare. Here’s how to calculate them:
| Metric | What It Measures | Formula |
|---|---|---|
| MTTF (mean time to failure) | Average working time before a failure | Total working time / number of failures |
| MTTR (mean time to repair) | Average time to restore the system | Total repair time / number of repairs |
| MTBF (mean time between failures) | Average time between two consecutive failures | MTTF + MTTR |
| Availability | Share of time the system is ready for use | MTTF / (MTTF + MTTR) × 100% |
| Failure rate | Failures per hour of work | Number of failures / total working time |
| POFOD (probability of failure on demand) | Chance that a request fails | Failed requests / total requests |
Teams use two conventions for MTBF. Some teams count working time only, so MTBF equals MTTF. Other teams include repair time and use MTTF + MTTR. You need to choose a convention and write it in your test plan, so everyone reads the numbers the same way.
Reliability Metrics Example
Say you run an endurance test on a checkout service for 30 days, or 720 hours. The service fails 4 times, and the team needs 2 hours on average to restore it after each failure. That gives 8 hours of downtime and 712 hours of work.
Here’s the calculation:
- MTTF = 712 / 4 = 178 hours
- MTTR = 8 / 4 = 2 hours
- MTBF = 178 + 2 = 180 hours
- Availability = 178 / 180 × 100% = 98.9%
- Failure rate = 4 / 712 = 0.0056 failures per hour
If your target is 99.5% availability, this build fails the target. A 99.5% target allows only 3.6 hours of downtime in 720 hours, and the service had 8.
Reliability Growth and Prediction
Reliability growth is the rise in MTBF as the team fixes defects across builds. Reliability growth models, such as the Musa basic execution time model, use failure data from test runs to predict the reliability of the next build. For example, if MTBF grows from 120 hours to 180 hours over five builds, the model estimates when the product will reach a 200-hour target. The prediction is accurate only when testing is conducted in a frozen environment with the same operational profile.
Metrics for Test Suite Reliability
Product metrics use test results as input, so your tests need their own metrics too. In The State of Continuous Integration Testing @Google, John Micco reported that almost 16% of Google’s 4.2 million tests had some level of flakiness.
You can track four metrics for the test suite:
- Pass rate over time. The share of runs in which a test passes on the same code, shown by date.
- Flaky test rate. The share of tests that both pass and fail on the same code.
- Rerun rate. How often the team reruns failed tests before a merge or a release.
- Systematic failures. Tests that fail on every run during a period, for example the last 30 days.
How To Do Reliability Testing: Key Steps To Follow
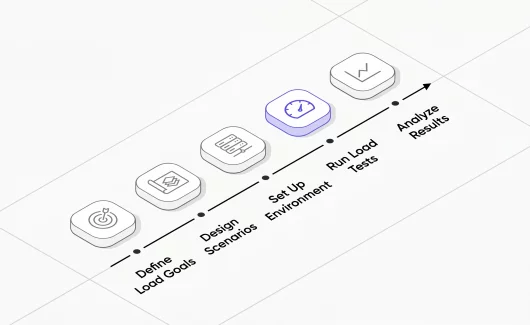
A reliability test gives useful numbers only when the team agrees on a target and fixes the test environment before the run. Here’s the testing process most QA teams follow:
- Numeric target. You need a measurable goal, for example 99.5% availability over 30 days or MTBF of at least 200 hours.
- Operational profile. This profile describes how real users work with the system. For example, 55% of sessions browse products, 25% search, 12% add items to the cart, and 8% pay.
- Types of test for each risk. You can use endurance tests for memory leaks and recovery tests for database failover.
- Frozen build and environment. You define the test environment and freeze the build. After every code change during a 14-day run, you need to start the measurement again, because you now test a different system.
- Test runs and failure records. Each failure record needs a timestamp and the error message, plus the repair time for MTTR and a link to the defect.
- Metric calculation. You compare MTBF and availability with the target from step 1.
- Defect fixes and a repeat run. A new build needs a new measurement, so you return to step 4. This repeat run ensures that the system meets the target after each fix.
What to Include in a Reliability Test Plan
A reliability test plan helps the whole team agree on what counts as a failure before the test starts. A clear plan also helps ensure that the software meets the same exit criteria on every run. Here are the sections a complete plan contains:
| Section | What to Write | Example |
|---|---|---|
| Scope | Systems and user journeys under test | Checkout API and payment service |
| Reliability target | Numeric goal | 99.5% availability over 30 days |
| Operational profile | Traffic mix and peak hours | 55% browse, 8% pay, peak at 19:00 |
| Test types | Methods for each risk | Endurance and recovery tests |
| Environment | Infrastructure and data | Staging with 40 million order records |
| Duration | Length of each run | 72-hour endurance run every week |
| Exit criteria | Pass/fail rules | MTBF above 200 hours and 0 data loss events |
| Failure log format | Fields for each failure | Timestamp, error, repair time, defect link |
Reliability Testing in CI/CD Pipelines
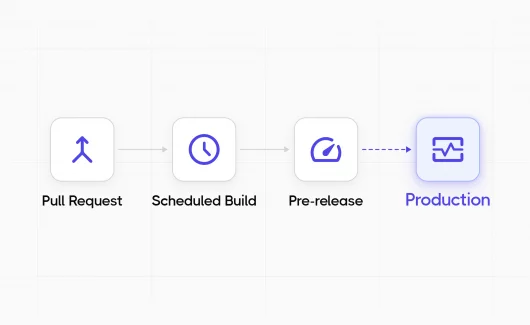
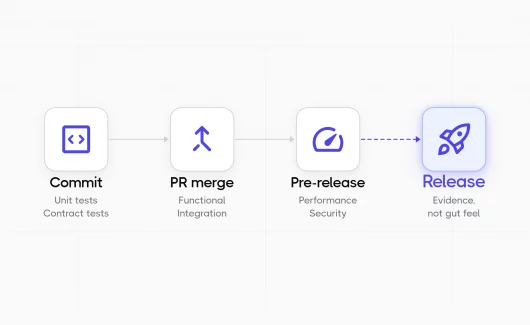
Long endurance runs take hours, so teams spread reliability checks across the development process by schedule. This approach fits continuous testing in DevOps, where each pipeline stage has checks that match its time limit:
- Every pull request: a 5-minute smoke load test and short recovery tests.
- Every night: a 6-hour endurance run on the main branch.
- Every week: a 48-hour soak test and chaos experiments on staging.
- Before a major release: a full run of the software product against the reliability target.
Thirty nightly runs show if MTBF grows or drops after each merge. This trend helps you connect a reliability drop to a specific change.
How Do You Know If Your Tests Are Reliable?
Your tests are reliable when the same code gives the same result on every run. You can check the consistency and reliability of your suite with pass rate history and a flaky test rate.
Testing reliability matters as much as product reliability, because every reliability metric uses test results. A flaky test is a test that passes and fails on the same code. In the same Google report, flaky tests caused 84% of transitions from pass to fail.
So when a flaky test fails during an endurance run, your failure log records a test problem as a product failure. MTBF drops, and the release team makes a decision with wrong data. Our guide on how to fix flaky tests in your test framework explains the common causes.
Find Flaky Tests From Run History
You need run history to find flaky tests, because a single run shows only pass or fail. Testomat.io flaky tests analytics compares the results of each test over many runs and shows tests with unstable results.
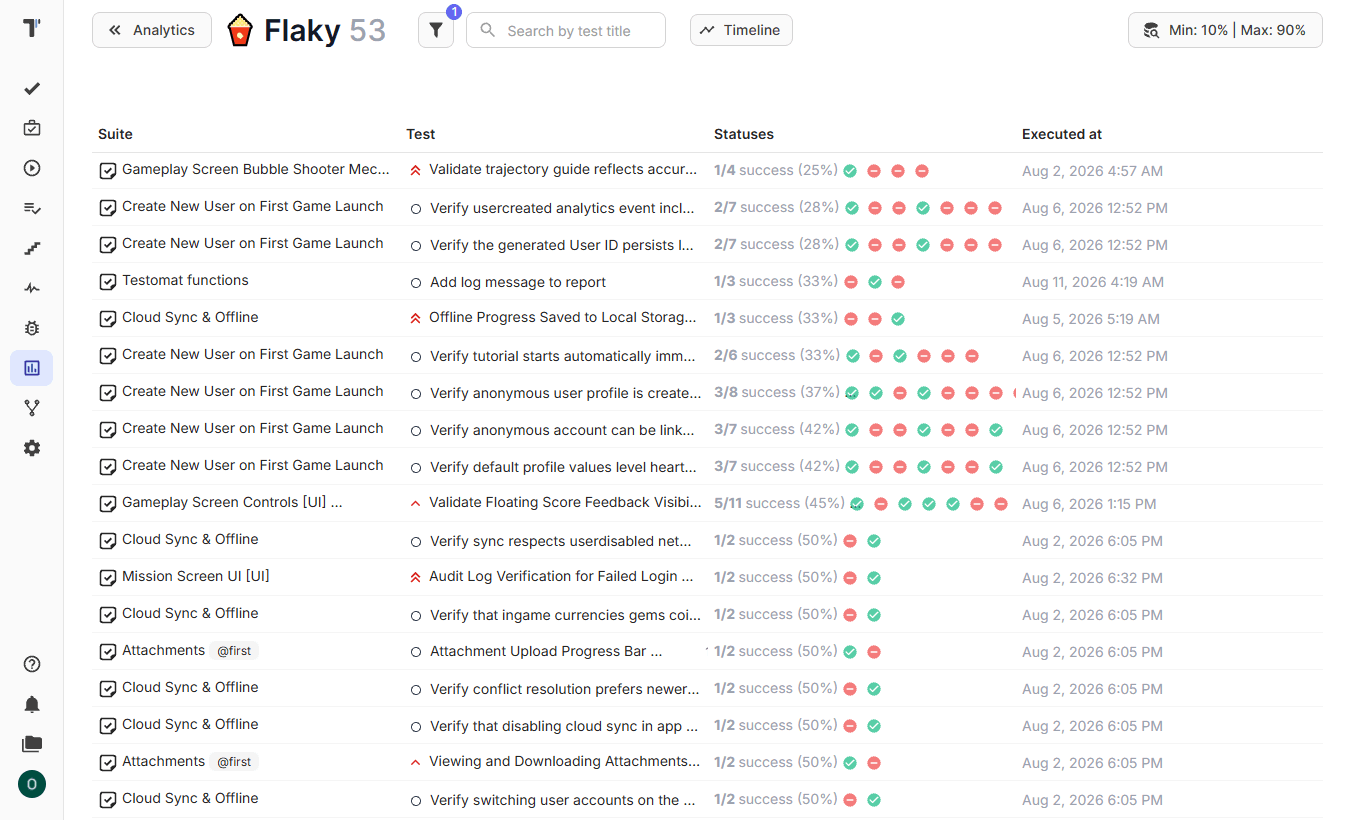
The Mark Flaky Tests agent in Testomat.io adds a Flaky label to these tests. You can change the detection rules in the Analytics Settings of your project. A second agent, Mark Failed Tests, labels tests that failed all the time during the last month. With these labels, you can separate test problems from product failures before you calculate MTBF.
Group Failures by Root Error
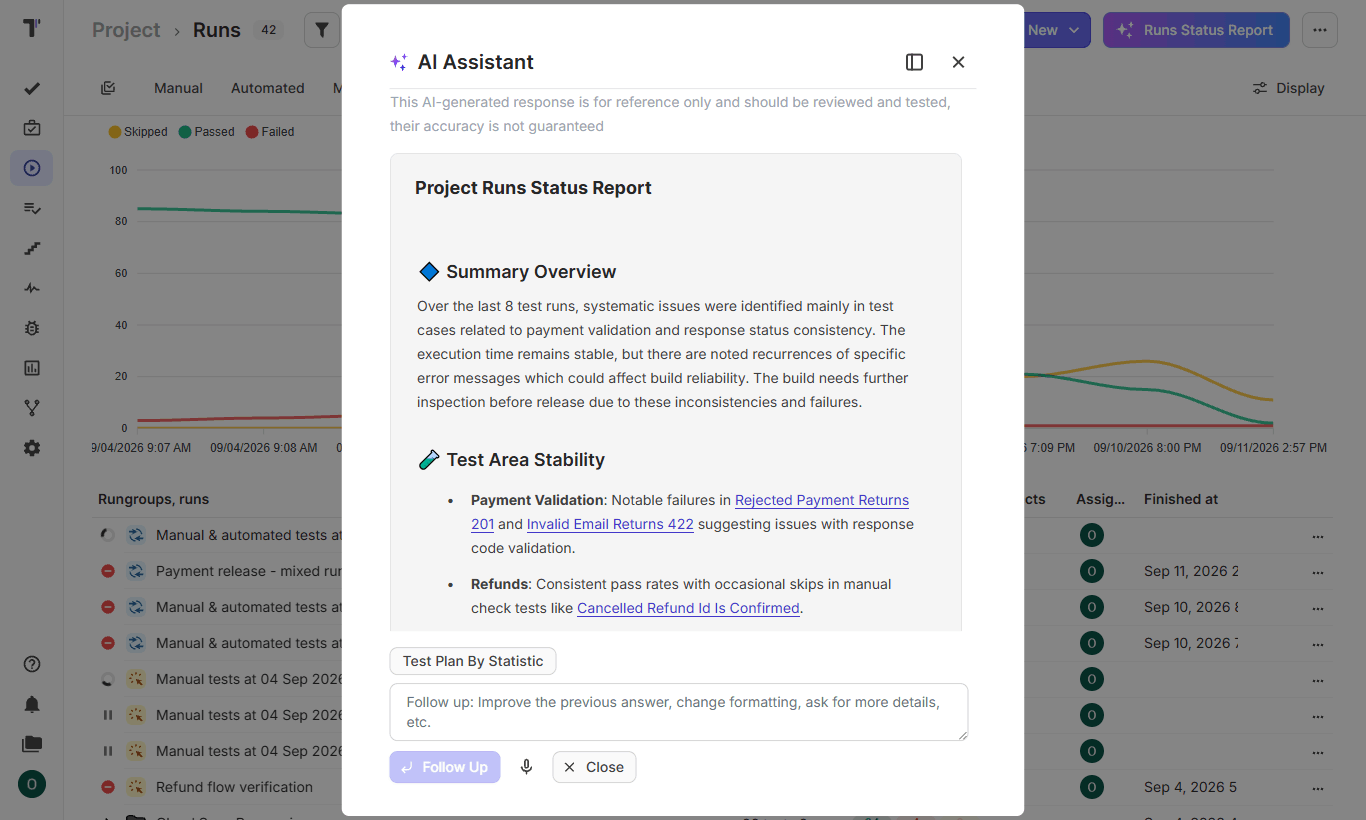
When 40 tests fail after a nightly run, the team needs to know if the run found 40 problems or 2. Testomat.io groups stack traces by identical root errors, so you see the real number of problems first. The Runs Status Report adds more detail. Testomat.io generates this report with AI from recent run history. Its Top Errors section lists the most frequent failure messages, and its Systematic Failures section shows test cases that failed consistently and may block critical user flows.
Rerun Only the Failed Tests
Reruns cost time and infrastructure. The Google report shows that the company spent between 2% and 16% of its test compute resources on re-running flaky tests. With Advanced Relaunch in Testomat.io, you can restart only the failed or selected tests from a previous run. You can also relaunch automated tests as a manual run when a tester needs to confirm the result by hand.
Agent Reliability Testing for AI Features
Agent reliability testing checks if an AI agent completes the same task consistently and reliably across many runs. AI agents can give different outputs for the same input, so you need many runs of the same task to measure reliability.
If an agent succeeds in 90% of single attempts, the chance of 8 successful attempts in a row is about 43% (0.9 to the power of 8). Users run the same task many times, so this second number describes their real experience.
Here’s how you can test the reliability of an AI agent:
- Repeated tasks. You run each task 30 times with the same prompt and the same test data.
- Success rate. For example, 27 correct results out of 30 gives a success rate of 90%.
- Tool call checks. An agent can reach the right answer with the wrong steps, so you need to check each tool call.
- Cost and latency per run. Retries inside the agent increase both, so you record them for every run.
- Comparison after changes. After each model or prompt change, you repeat the full set and compare the success rate with the previous version.
What are the Common Challenges?
Reliability testing needs time and stable conditions, and both are hard to get in a busy software development cycle. Here are the challenges QA teams meet most often:
- Long test duration. A 30-day run occupies a test environment for a month. Many teams use accelerated tests with higher load to compress this time.
- Limits of time compression. In a Ministry of Testing discussion about a 21-day accelerated run, practitioners noted that compressed tests miss date rollovers and leap years. Slow hardware wear also needs months of real use to appear.
- Environment drift. A staging database with 10,000 rows behaves differently from a production database with 40 million rows, so your staging data needs a realistic size.
- Vague requirements. You need to convert each vague requirement into a number, for example 99.5% availability over 30 days, before the first run.
What are the Best Practices?
These practices help you get trustworthy results from reliability tests and track the overall reliability of each build:
- A written target before the first run. The team then judges results against a fixed goal.
- Percentiles next to averages. 5% of users can wait 3 seconds while the average response time stays at 400 ms.
- Flaky test labels before a reliability run. With these labels, the failure log contains product failures only.
- MTBF comparison between builds. The trend shows if each change is enhancing reliability or reducing it.
- A defect link for every failure. You can track the fix and repeat the test on the new build.
How Reliability Testing Supports Release Decisions
Reliability numbers help only when the release team can read them before a go/no-go meeting. In many teams, endurance results stay in a monitoring tool, and test results stay in CI logs.
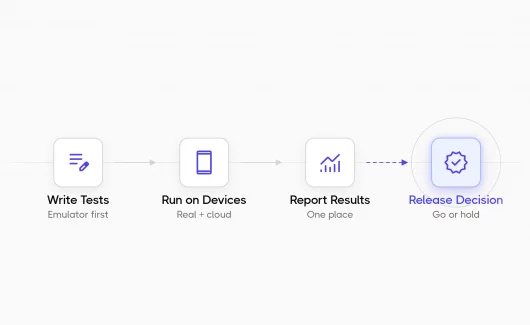
Testomat.io works as a control center for these quality signals and collects results from automated and manual runs in one place. The test report analytics show reliability data and the defects that block a release on the same screen:
- Runs Status Report shows the overall pass rate and execution time trends for recent runs, with stability grouped by feature area.
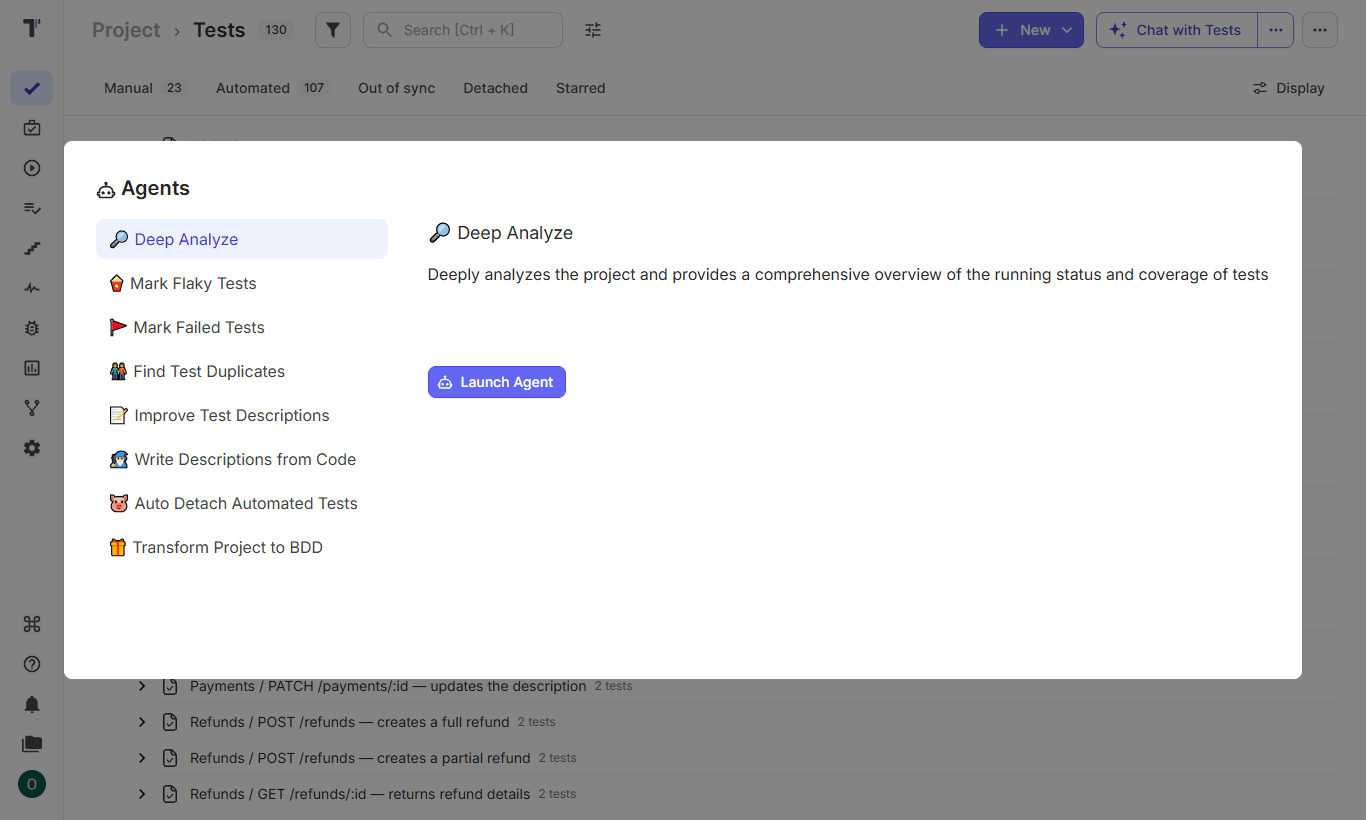
- Deep Analyze Agent compares planned coverage with executed coverage and flags low-pass-rate and high-risk areas. Its release readiness check helps the team make a go/no-go decision.
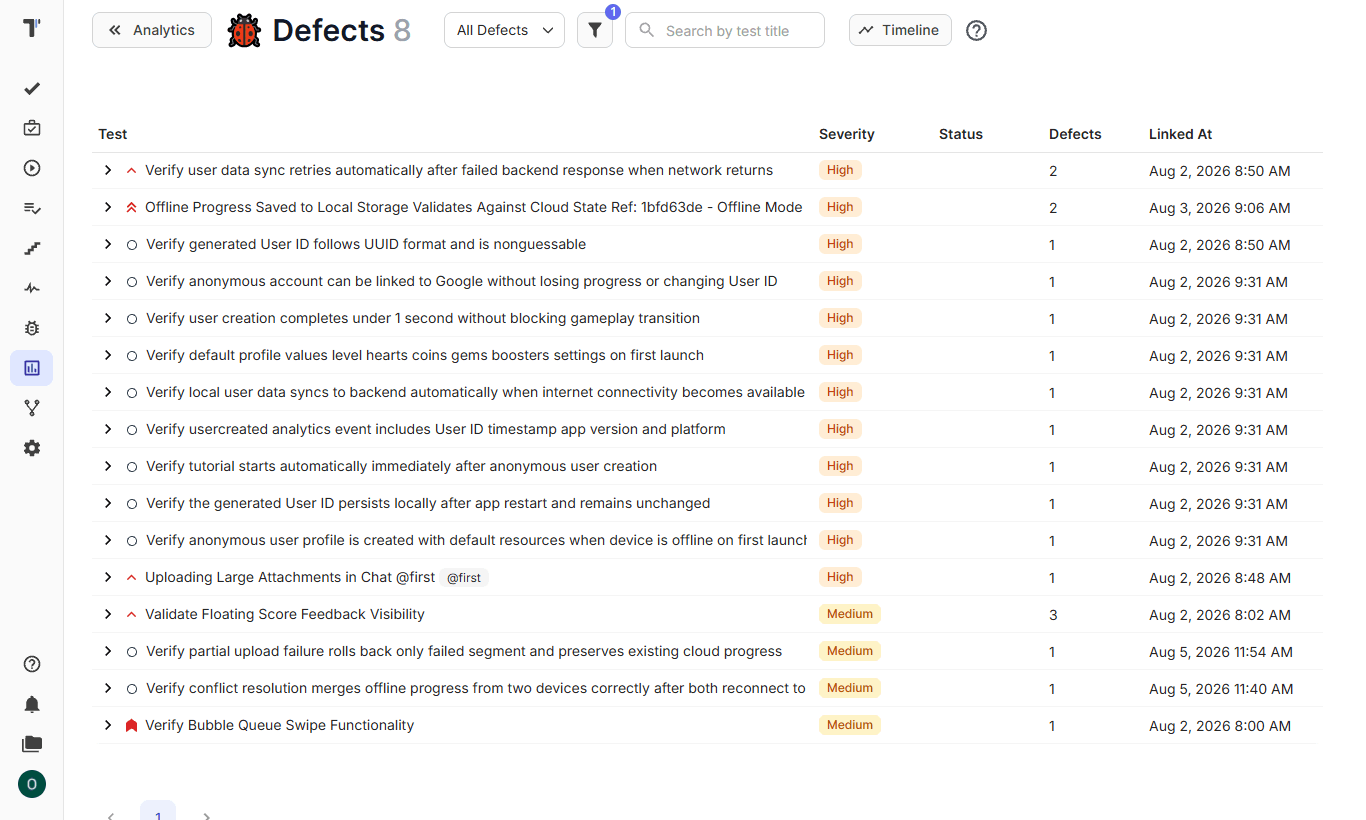
- Defects in Analytics lists the tests that defects block, with the severity and status of each defect.
- Run statistics widget shows a trend chart of pass and fail rates for the selected period on the company dashboard.
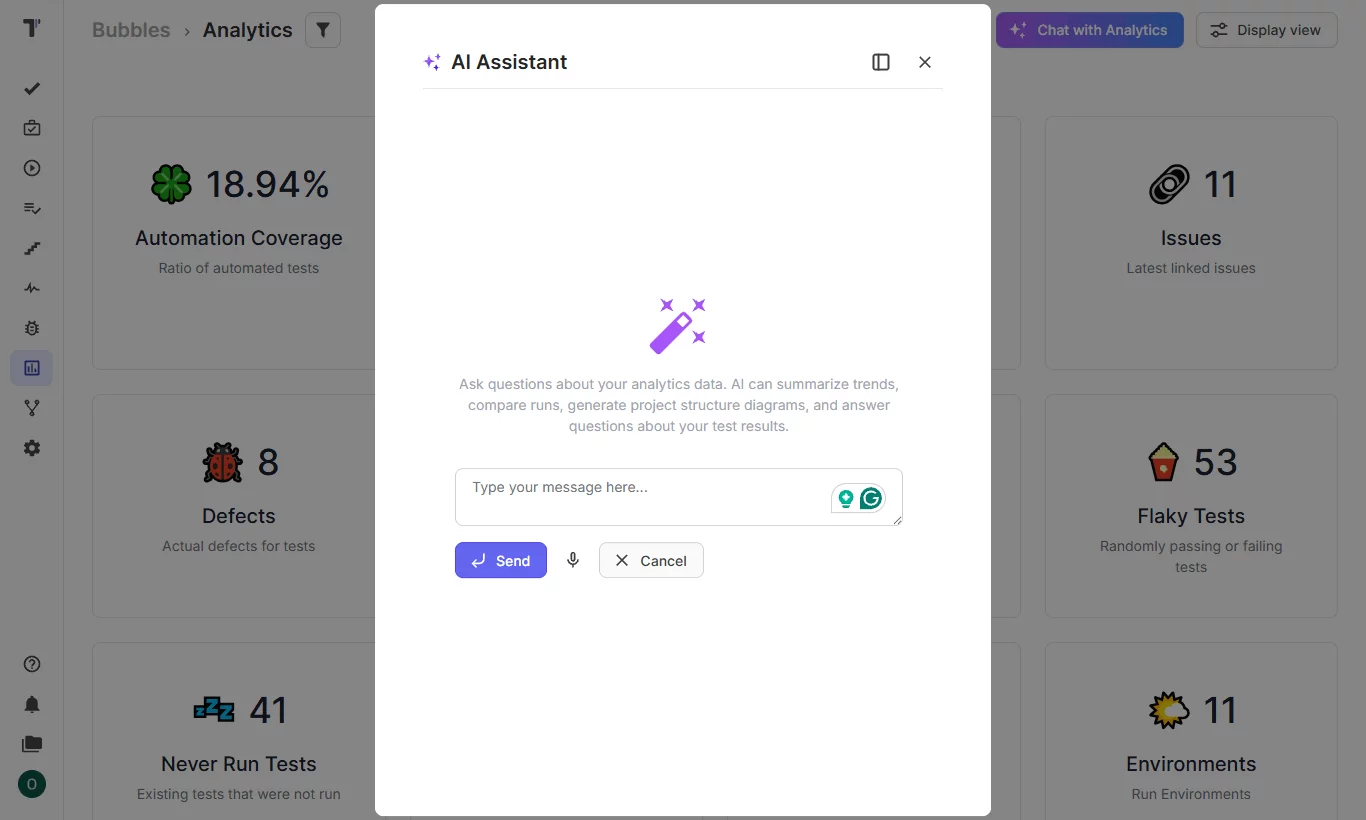
- Chat with Analytics answers questions such as which tests are most unstable, based on your project analytics data.
For example, a release manager can see that the checkout suite passed 97% of nightly runs in the last 30 days and that 3 open defects block 11 tests. With these facts, the team can make the go/no-go decision in a short meeting.
Bottom Line: What About Making Reliability Part of Every Release?
Reliability testing gives your team clear numbers about the stability of the software product, such as MTBF and availability. Regular runs help ensure that software stays dependable as the team adds new features. These numbers need stable tests, so flaky test analysis belongs in the same process as endurance and recovery testing. Try Testomat.io for free and see flaky tests and stability trends for your suite in one place.