




Many QA teams run performance engineering testing as a single load test before a release. The test passes in staging, and the results stay in the load testing tool. But the release team checks a different dashboard. According to the Capgemini report, 94% of organizations review production data, and nearly half find it hard to use these insights. In this guide, you’ll learn how performance engineering works and how its results can support release decisions.
What Is Performance Engineering Testing?
Performance engineering testing checks speed and stability at every stage of development. After that, each stage has its own check:
- Requirements. The team writes performance targets as numbers, so every later check has a pass/fail result.
- Design. Architects review caching, database queries and service limits against those targets.
- Development. Developers profile slow code and measure critical operations before a merge.
- CI pipeline. Each build runs a short load test, and the results stop a merge when the numbers get worse.
- Production. Monitoring shows real user response times and feeds them back into the next round of targets.
Performance testing is a part of this work, and performance engineering repeats these checks during the whole lifecycle.
What Is the Difference Between Performance Engineering and Performance Testing?
Performance testing measures how a system works under load at a specific moment. Performance engineering plans and checks performance during the whole development lifecycle. The difference matters because it changes who owns performance and when the team checks it.
Performance Engineering vs Performance Testing Compared
Performance testing in software engineering is a specific activity inside a bigger practice. Here’s how the two approaches compare:
| Area | Performance Testing | Performance Engineering |
|---|---|---|
| Timing | Before a release or after a big change | From requirements to production |
| Owner | QA engineers or a performance test engineer | The whole delivery team |
| Result | A report for a specific test run | Performance limits in CI and trends from production |
| Main question | Can the system handle 2,000 users today? | Does each new change keep the system fast? |
Load tests and stress tests are two common types of performance testing. Each type answers a different question about capacity, so a performance engineering plan usually combines several types.
Roles and Ownership on the Team
Performance engineering needs clear ownership, because each role sees a different part of the problem. Here’s a typical split:
- Developers profile slow code and optimize database queries before a merge.
- QA engineers write performance tests for the main user journeys and add these tests to CI.
- Performance test engineers design workload models and run large load and stress tests before a release.
- SRE teams (site reliability engineering) keep production systems stable. They track response times and errors in production and tell developers when performance gets worse.
What Are the Benefits of Performance Engineering Testing?
Performance engineering testing finds speed problems early, when a fix costs less. It also gives release teams measurable data for each release decision. Google commissioned a study in which Deloitte and the agency 55 analyzed 37 European and American brand sites with more than 30 million user sessions. According to the Milliseconds Make Millions case study, a 0.1-second improvement in mobile site speed increased conversion rates by 8.4% for retail sites and by 10.1% for travel sites.
Other benefits show in daily work:
- Cheaper fixes. A developer fixes a slow query in the same pull request because the change is small at this stage.
- Fewer production incidents. Stress tests and soak tests find capacity limits and memory leaks before a release, so users meet fewer slowdowns during peak traffic.
- Lower infrastructure costs. Profiling shows which code uses the most CPU time, so the team can optimize this code before it buys more servers.
- Clear release decisions. Performance limits give a pass or fail result for each release, and release managers see this result next to functional test results.
The Performance Engineering Lifecycle
Published guides describe the performance engineering lifecycle in six or seven phases. In practice, the phases repeat because production data creates new requirements for the next release.
Writing Requirements as Measurable Performance Limits
Performance requirements often start as vague sentences, for example, checkout must be fast. You can test a requirement only when it has a number, so you need to rewrite each requirement as a measurable performance limit. Our guide to non-functional requirements explains how to write these requirements. A p95 value means that 95% of requests finish within this time.
| Vague Requirement | Performance Limit | Test and Schedule |
|---|---|---|
| Checkout must be fast | p95 response time under 800 ms at 1,500 users | Load test, scheduled build |
| Search must handle sale traffic | Error rate under 1% at 3x normal traffic | Spike test, pre-release |
| The app must stay stable | Memory growth under 5% in 8 hours | Soak test, weekly |
| Reports must load quickly | p95 under 2 seconds for a 10,000-row report | Short check, each pull request |
Requirements often come from meetings with product owners. In Testomat.io, a QA lead can dictate requirements with Voice Mode during the call. AI then improves the grammar and formatting of the text. After the meeting, the lead adds a measurable performance limit to each requirement.
Profiling in Development and Monitoring in Production
Profiling shows which functions or database queries use the most CPU time and memory. Developers can run a profiler on a slow endpoint before they change the code, so they fix the real cause of the delay. Teams collect traces and metrics in production with OpenTelemetry, an open-source observability framework. The data shows which journeys real users follow in the app. You can use these journeys to update the workload model for the next load test.
How Do You Shift Left Performance Testing?
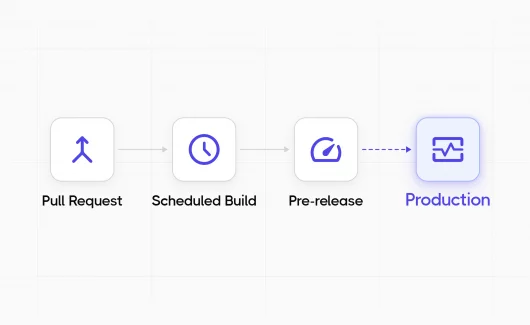
You can run short performance checks on the main endpoints in each pull request. Full load tests and soak tests run in scheduled and pre-release pipelines. Shift left performance testing means you check performance early in the pipeline, when a fix costs less. A 2-minute check with 20 virtual users shows a slow query on the day a developer adds it. The same idea works for functional tests, as our guide to shift-left testing explains.
A Test Schedule for Each Pipeline Stage
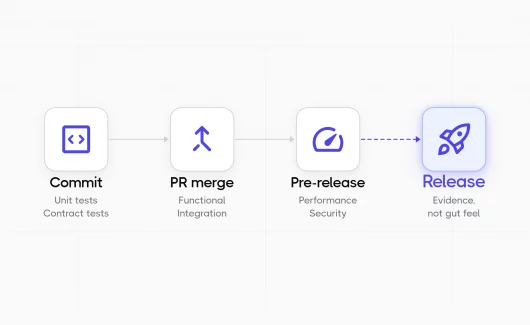
Each pipeline stage has a different time budget, so each stage needs a different test size.
| Stage | Test | Example Size | Goal |
|---|---|---|---|
| Pull request | Short performance check | 20 virtual users, 2 minutes | Find slow endpoints before a merge |
| Scheduled build | Load test at expected peak | 1,500 virtual users, 30 minutes | Compare p95 with the previous run |
| Pre-release | Stress and soak tests | Up to 3x peak, 8 hours | Find the capacity limit and memory leaks |
| Production | Monitoring | Real traffic, 24/7 | Compare real traffic with the test model |
Setting Pass or Fail Limits
Load testing tools usually let you set pass or fail limits for each test. For example, a limit can require that 95% of requests finish in under 500 ms and that less than 1% of requests fail. If the results exceed a limit, the tool returns an error exit code. The CI job then fails, so the team sees the problem early.
How to Report Performance Results With Functional Tests
After the run, performance results usually stay in CI logs or in a separate dashboard. QA managers see functional results in the test management system and performance results in another tool, so the release view has a gap. You can fix this with JUnit XML: the load testing tool runs the test, and Testomat.io stores the results next to your functional runs.
Exporting Performance Results as JUnit XML
JUnit XML is a common report format for test results, and most CI systems can read it. Many load testing tools can export results in this format, either directly or through a plugin. You can find the exact setup in the reporting section of your tool’s documentation.
In the XML file, each performance limit becomes a test case, so a failed limit appears as a failed test. Here’s a simplified example:
<testsuite name="Checkout load test" tests="2" failures="1">
  <testcase name="p95 response time under 500 ms">
    <failure message="p95 was 640 ms"/>
  </testcase>
  <testcase name="Error rate under 1%"/>
</testsuite>
Importing and Tracking Results in Testomat.io
Testomat.io supports JUnit XML import, so you can send the file with the report-xml command from the @testomatio/reporter package. You need the package and your project API key:
npm install @testomatio/reporter --save-dev

TESTOMATIO={API_KEY} \
TESTOMATIO_TITLE="Scheduled load test" \
TESTOMATIO_ENV="staging" \
TESTOMATIO_LABEL="performance" \
npx report-xml "junit.xml"
TESTOMATIO_LABEL adds the performance label to the run. You need to create this label with the runs scope in your project settings before the first import. TESTOMATIO_ENV saves the environment. Reports then show staging runs and production runs separately.
If a test name contains text in parentheses, the reporter reads this text as a test parameter. For example, a name like p(95)<500 appears as p<500, so you need to rename these tests in the file before the import.
You can follow the pass and fail history of each performance limit after a few runs. AI reports on run history add a summary with the pass rate trend and the tests that fail repeatedly. If your team prefers its own dashboards, Public API v2 returns run results grouped by label, so you can add statistics for the performance label to these dashboards.
Automating Performance Tests in CI/CD Pipelines
In CI, the import runs as a separate step after the load test. Most teams run this step in the CI tool they use for functional tests, and the report-xml command works the same way in every pipeline.
| CI Tool | Schedule | Import After a Failed Load Test |
|---|---|---|
| Jenkins | triggers { cron('H 2 * * *') } in the Pipeline file |
post { always { ... } } block |
| GitLab CI/CD | Pipeline schedules in project settings | when: always on the import job |
| CircleCI | Scheduled pipelines in project settings | when: always on the import step |
| GitHub Actions | on: schedule with a cron value |
if: always() on the import step |
The last column matters because the load test step ends with an error when a result exceeds a limit. With this setting, the import step runs after a failed load test too, so failed results also reach Testomat.io. Jenkins and GitLab CI/CD can also show the JUnit file in their own test reports, with the junit step in Jenkins and artifacts:reports:junit in GitLab. If your team compares CI tools, our Jenkins vs GitHub Actions comparison explains the differences.
How Performance Engineering Teams Use Test Data for Release Decisions
Release managers need a clear quality status before each release. In Testomat.io, you can see this data on the milestone page of the release:
- Tests and runs. The milestone groups the tests and test runs for the release.
- Performance results. When you assign the scheduled performance run to the milestone, its result appears next to the regression runs.
- Requirements. With requirements traceability, the release manager sees which performance requirement each test covers.
- Defects. If a limit fails, a QA engineer can create a defect from the run report, and the defect appears on the Defects tab of the milestone.
Here’s how this works for the checkout requirement from the table above:
- The requirement links to a load test with a measurable performance limit.
- The scheduled load test runs, and the reporter sends the result to Testomat.io.
- The milestone shows the latest result for this test.
- The release manager checks this result and the open defects before the release decision.
Release readiness with the Deep Analyze Agent. Before a release, the Deep Analyze Agent reviews the whole project:
- Project scan. The agent scans the project structure and execution history.
- Coverage check. It compares planned coverage with executed coverage.
- Risk flags. It flags high-risk areas with low pass rates.
- Release readiness check. It gives QA leads and product managers the data for the release decision.
AI Performance Engineering: What It Can Do Today
AI performance engineering is a new area. According to the Capgemini World Quality Report 2025-26, 43% of organizations experiment with Gen AI in QA, and 15% use it at enterprise scale. So today, the most practical use of AI is the analysis of run data that your team already collects. In Testomat.io:
- AI Analytics Chat answers questions about project analytics. For example, you can ask which tests are the most unstable or how execution trends changed in the last 30 days.
- MCP Server v2.0 connects AI assistants like Claude and Cursor to the Public API v2, so a coding agent can check recent run results before it changes code.
Workload modeling needs human judgment because a person decides which user journeys matter and how traffic grows during a sale. Production data from monitoring gives the best input for this decision.
Performance Engineering Tools in 2026
Performance engineering tools belong to five groups, and most teams combine them.
| Group | Examples | Question It Answers |
|---|---|---|
| Load testing | k6, Gatling, JMeter, Locust | How does the system work under expected and peak load? |
| Profiling | async-profiler for Java, py-spy for Python | Which code uses the most CPU time or memory? |
| Observability | OpenTelemetry, Prometheus, Grafana, Jaeger | How does the system work for real users in production? |
| CI/CD automation | Jenkins, GitLab CI/CD, CircleCI, GitHub Actions | When and where do the performance tests run? |
| Results and release decisions | Testomat.io | Did the performance tests pass, and is the release ready? |
k6 and Gatling store load tests as code, so developers can review these tests in pull requests. JMeter uses XML test plans with a desktop interface, and Locust uses Python scripts. For a detailed comparison of load testing tools, you can read our list of performance testing tools.
Bottom Line: Ready To Make Performance Part of Every Release Decision?
Performance engineering testing works best when you measure performance in every pipeline stage and use the results in release decisions. The Testomat.io reporter reads JUnit XML files from your load testing tool and shows performance results next to functional results in the same run history. If you are ready to import your first performance test report, try Testomat.io AI test case management system for free.