


Predictive test analytics helps you estimate which tests will likely fail and how risky your next release is. It combines historical data from your test runs with current data from code changes. You don’t need to buy test data for predictive analytics. Your CI pipeline already saves most of it for free. After each run you get a pass rate and a list of failed tests. These numbers describe the past. On release day you need answers about the next build: is it safe to release, and which tests should you run first? You can add a model later. First, you need a clean run history, and this is the harder part. You don’t need a data analyst or a large analytics program to start.
The question “are we ready to release?” takes a meeting to answer.
Read also: QA Strategy Guide: Components, Steps, Metrics and Template
What Is Predictive Test Analytics?
Predictive test analytics is the practice of using past test results to estimate future test outcomes and release risk. It is a part of data analytics. Predictive analytics is the use of statistical methods and machine learning techniques to predict future outcomes based on historical data. In business analytics, banks use it to measure credit risk, and factories use it for predictive maintenance.
In QA, you apply the same techniques to predict test failures and release risk. With classic test automation reporting, you see runs that have finished. With predictive analytics, you take the same data and estimate the next run. So you don’t need new data sources to start. You need a longer and cleaner history. Meta deployed this approach in production. Its research team presented a predictive test selection system and described the method in a research paper. You can read about the statistical models in our guide on predictive analytics in QA.
Analysts expect fast adoption of AI in testing. Gartner predicts in its Market Guide for AI-Augmented Software-Testing Tools that 80% of enterprises will use these tools by 2027, while the share was about 15% in early 2023.
Types Of Predictive Models For Test Data
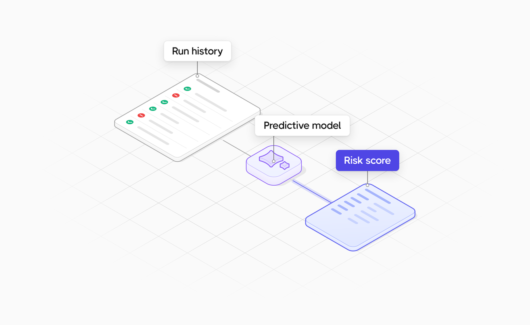
A predictive model learns from data from the past and gives you an output, such as a risk score for each test. Common types of predictive models for test data are:
- Regression models and decision trees, mathematical and statistical models that work with smaller data sets.
- Neural networks and other deep learning methods, which need very large amounts of data and fit companies with big data in CI.
Model building is a part of the analysis process, and it starts with data preparation. You remove flaky failures from the run history and split the dataset into subsets for training and for testing the model. In the training data, each test run is a data point with a set of features, such as:
- Changed files
- Test type
- Past failures
- Duration
Some features are categorical, for example the test framework. The model converts them into a vector of numbers.
Run history is also time series data, because each result has a date. Using data like this, machine learning algorithms find patterns in large data sets. In data science, this process is close to data mining. The output of this predictive analysis is a ranked list of tests.
Descriptive vs Predictive Test Analytics: What Is The Difference?
Both types of test analytics use data from your test runs. Descriptive analytics helps you understand the last run, and predictive analytics helps you plan the next run. The table below shows what you can do with each type.
| Descriptive test analytics | Predictive test analytics |
|---|---|
| See what happened in the last run | Estimate what will likely fail in the next run |
| Get a pass rate and a list of failed tests | Get a risk score and a ranked list of tests |
| Decide which failed tests to fix | Decide what to test and when to release |
| Work with data from the latest run | Use run history and code changes |
Basic reports show what happened. Advanced analytics predict problems.
Read also: 10 Test & Environment Management Best Practices for Agile Teams
There is also diagnostic analytics. It explains why a test failed. Predictive analytics uses this descriptive and diagnostic data to predict possible future failures.
What Can Test Data Predict Today?

With predictive analytics, you can use test data to predict which tests a code change will likely break and which failures are flaky. You can also see where defect risk is high and whether a build is ready for release.
#1: Tests Affected By A Code Change
For example, a developer on your team changes the payment form. Most tests in your test suite check other parts of the product. You need the tests that this change can break, and you need them fast. This matters most for slow stages, such as integration testing and end-to-end testing.
With predictive test selection, you use a machine learning model to choose the tests most likely to fail for a specific code change. Test impact analysis is a related technique. With it, you map the changed code to the tests that cover it.
The results from Meta show how many test runs you can save. According to the Meta Engineering blog, the system found more than 99.9 percent of regressions and ran a third of the tests.
Google shared newer results in 2025. In a paper for the ICST 2025 conference, its engineers described a model that chose 25% of the test targets. With this budget, the model found 85% of the breakages. The median time to find a new breakage dropped from 107 to 37 minutes.
You can run the selected tests on each commit and run the full regression testing suite at night.
#2: Flaky Failures
A flaky test passes and fails on the same code. You rerun the job, and the failed test passes. You can see this pattern in run history, so you can use predictive analytics to detect flaky tests and mark them. In a 2025 study, researchers found 810 flaky tests in 24 Java projects. Of these tests, 75% belonged to clusters of tests that failed at the same time, and a cluster had 13.5 flaky tests on average. In our guide on how to fix flaky tests, you can learn what to do next.
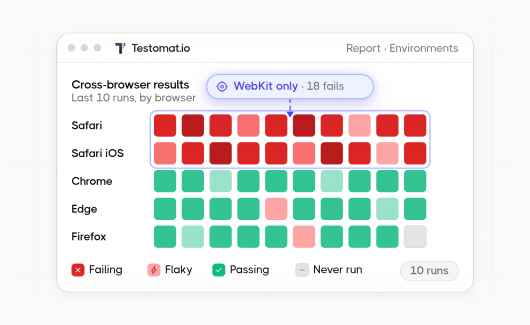
A test at 50% across every browser is flaky.
Read also: Automated Cross-Browser Testing: Frameworks, Matrix & CI/CD Reporting
#3: Areas With High Defect Risk
With risk-based testing, you give the most test effort to the areas where failure is most likely and most costly. You probably choose these areas from experience today. Run history and code change data give you evidence for that choice.
Code churn is a good example of such evidence. It measures how much of the code in a file or module changed. In a Microsoft Research paper, Nachiappan Nagappan and Thomas Ball studied Windows Server 2003. With statistical analysis of churn measures, they separated fault-prone binaries from the rest with 89% accuracy.
With test case prioritization, you use the same history to decide the order of tests and test the riskiest areas first. Predictive analytics can help with test coverage optimization too. You see risky areas with weak test coverage and add tests there.
#4: Release Readiness
Release readiness is an estimate of whether a build is safe to release. A failed release hurts your customer experience, and stable releases help you retain valuable customers. Predictive analytics helps you make this decision with data. A 100% pass rate is not enough for it. Some of your critical tests may have never run. Some passed tests may be flaky.
Release readiness is a decision based on evidence.
Read also: IoT Testing: Types, Tools and Best Practices for QA Teams
For a useful estimate, you need to combine these signals:
- Failed tests in critical areas
- The share of flaky failures
- Test coverage of changed requirements in a requirements traceability matrix
- Tests that never ran
You can connect these signals to quality gates in your pipeline. Then your pipeline blocks a build that does not meet your thresholds.
What Are The Benefits Of AI In Predictive Test Analytics?
The benefits of predictive analytics grow with your history. The more clean runs you have, the better the model’s output.
By using predictive analytics with artificial intelligence and machine learning, you can:
-
- Run fewer tests for each commit and find most regressions.
- Separate flaky failures from real failures.
- Group failures with a common cause and review them together.
- Base release decisions on data from many runs.
Machine learning algorithms identify unstable tests and even recommend fixes.
Read also: Generative AI in Software Testing: Best Tools, Strategies & Workflow
The gains are measurable. McKinsey surveyed nearly 300 public companies for its report Unlocking the value of AI in software development. The top performers improved software quality by at least 31 percent with AI.
What Data Do You Need For Predictive Test Analytics?
For a prediction, you need run history and failure details for every test. You also need code change data and links from tests to requirements. Predictive analytics uses these signals as features for the model.
| Signal | What it helps to predict | Typical source |
|---|---|---|
| Pass and fail history per test | Tests likely to fail | Test reports |
| Error messages and stack traces | Repeated root causes | Test reports |
| Test duration | Slow feedback | Test reports |
| Changed files per commit | Tests affected by a change | Version control |
| Test type and framework | Flakiness risk | Test repository |
| Links to requirements and defects | Release risk | Issue tracker |
Each reported run adds to the history of a test.
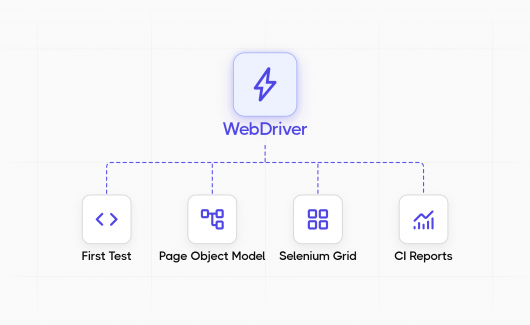
Read also: Selenium WebDriver Testing Guide: How To Build, Run And Report
Test type is an easy signal to miss. Google engineer Jeff Listfield analyzed the sources of flaky tests here. He measured a flaky share of 1.65% for all Google tests and 10.45% for Java WebDriver tests. If your suite has many UI tests, you can expect more flaky results there.
Why Do Predictive Test Analytics Projects Fail?

Most projects fail at the data preparation stage. Your test results stay in separate CI logs and tools. Flaky failures add false results to the history that trains your model.
Industry data confirms the pattern. The World Quality Report from Capgemini and OpenText surveyed 2,000 executives. Almost 90% of organizations work with generative AI in quality engineering, and only 15% reached enterprise scale.
You need to check your setup for these problems:
- Your CI system deletes logs after a short period.
- A test gets a new name and loses its history.
- You store manual test results in different software tools.
- Your history records flaky failures as real failures.
The last problem is expensive. Atlassian reported that flaky tests caused about 15% of failures in the Jira backend repository, and the reruns waste more than 150,000 developer hours each year. If your model learns from this history, it learns the wrong patterns.
How Can You Start With Predictive Test Analytics?

You can start with the data you already have. First you need to store all test results in the same tool and remove flaky failures. You can add models later.
- Collect all results in the same tool. You need to send results from every framework and CI job there and keep the full history. This practice is a part of TestOps.
- Give every test a stable ID. With a stable ID, you keep the history of a test after a rename or a move to another file.
- Mark flaky tests. You need to exclude flaky tests from release decisions until you fix them. You can keep a flaky test in quarantine. This is better than a red build that your team learns to ignore. Slack described this approach in 2022. After it automated flaky test detection and suppression, test job failures dropped from 57% to less than 5%.
- Track leading indicators every week. You can start with new failures in critical areas and repeated failure causes. After that, you can add the slowest tests and the tests that never ran. In our guide on software testing metrics, you can find more ideas.
- Add predictive test selection to your CI or build tool. You need a CI or build tool with this feature. This step fits a continuous testing pipeline.
- Compare predictions with real results. You need to measure how many real failures the selected tests found. At the start, your numbers can be lower, because your history is short.
How Does Testomat.io Help You Plan Releases With Test Data?
Testomat.io is a test management and quality intelligence platform. With it, you keep manual and automated test results together and get the signals that predictions need. When you compare a predictive test failure analytics tool or AI services for predictive test analytics, start with the data. A model is as good as its training data. Your CI or build tool selects and runs the tests. Testomat.io receives the results and keeps the history for your data analysis.
#1: Manual And Automated Results Together
You can send results to Testomat.io from frameworks such as Playwright and Cypress. From other tools, you can send results in JUnit XML format. With mixed runs, you add manual and automated tests to the same run. So your manual check before a release appears next to your Playwright results. Testomat.io keeps test results history, so you can return to old runs when you build a prediction.
#2: Signals From Analytics And AI
In the testing analytics dashboard, you see the signals from the table above. You get run statistics with a trend chart and a comparison of test runs. You can set the thresholds for flaky tests and slow tests for your project. The main signals you get are:
- Flaky tests analytics marks unstable tests for you with statistical data.
- AI failure clusterization groups failures with a common cause, so you can review similar errors as a single problem.
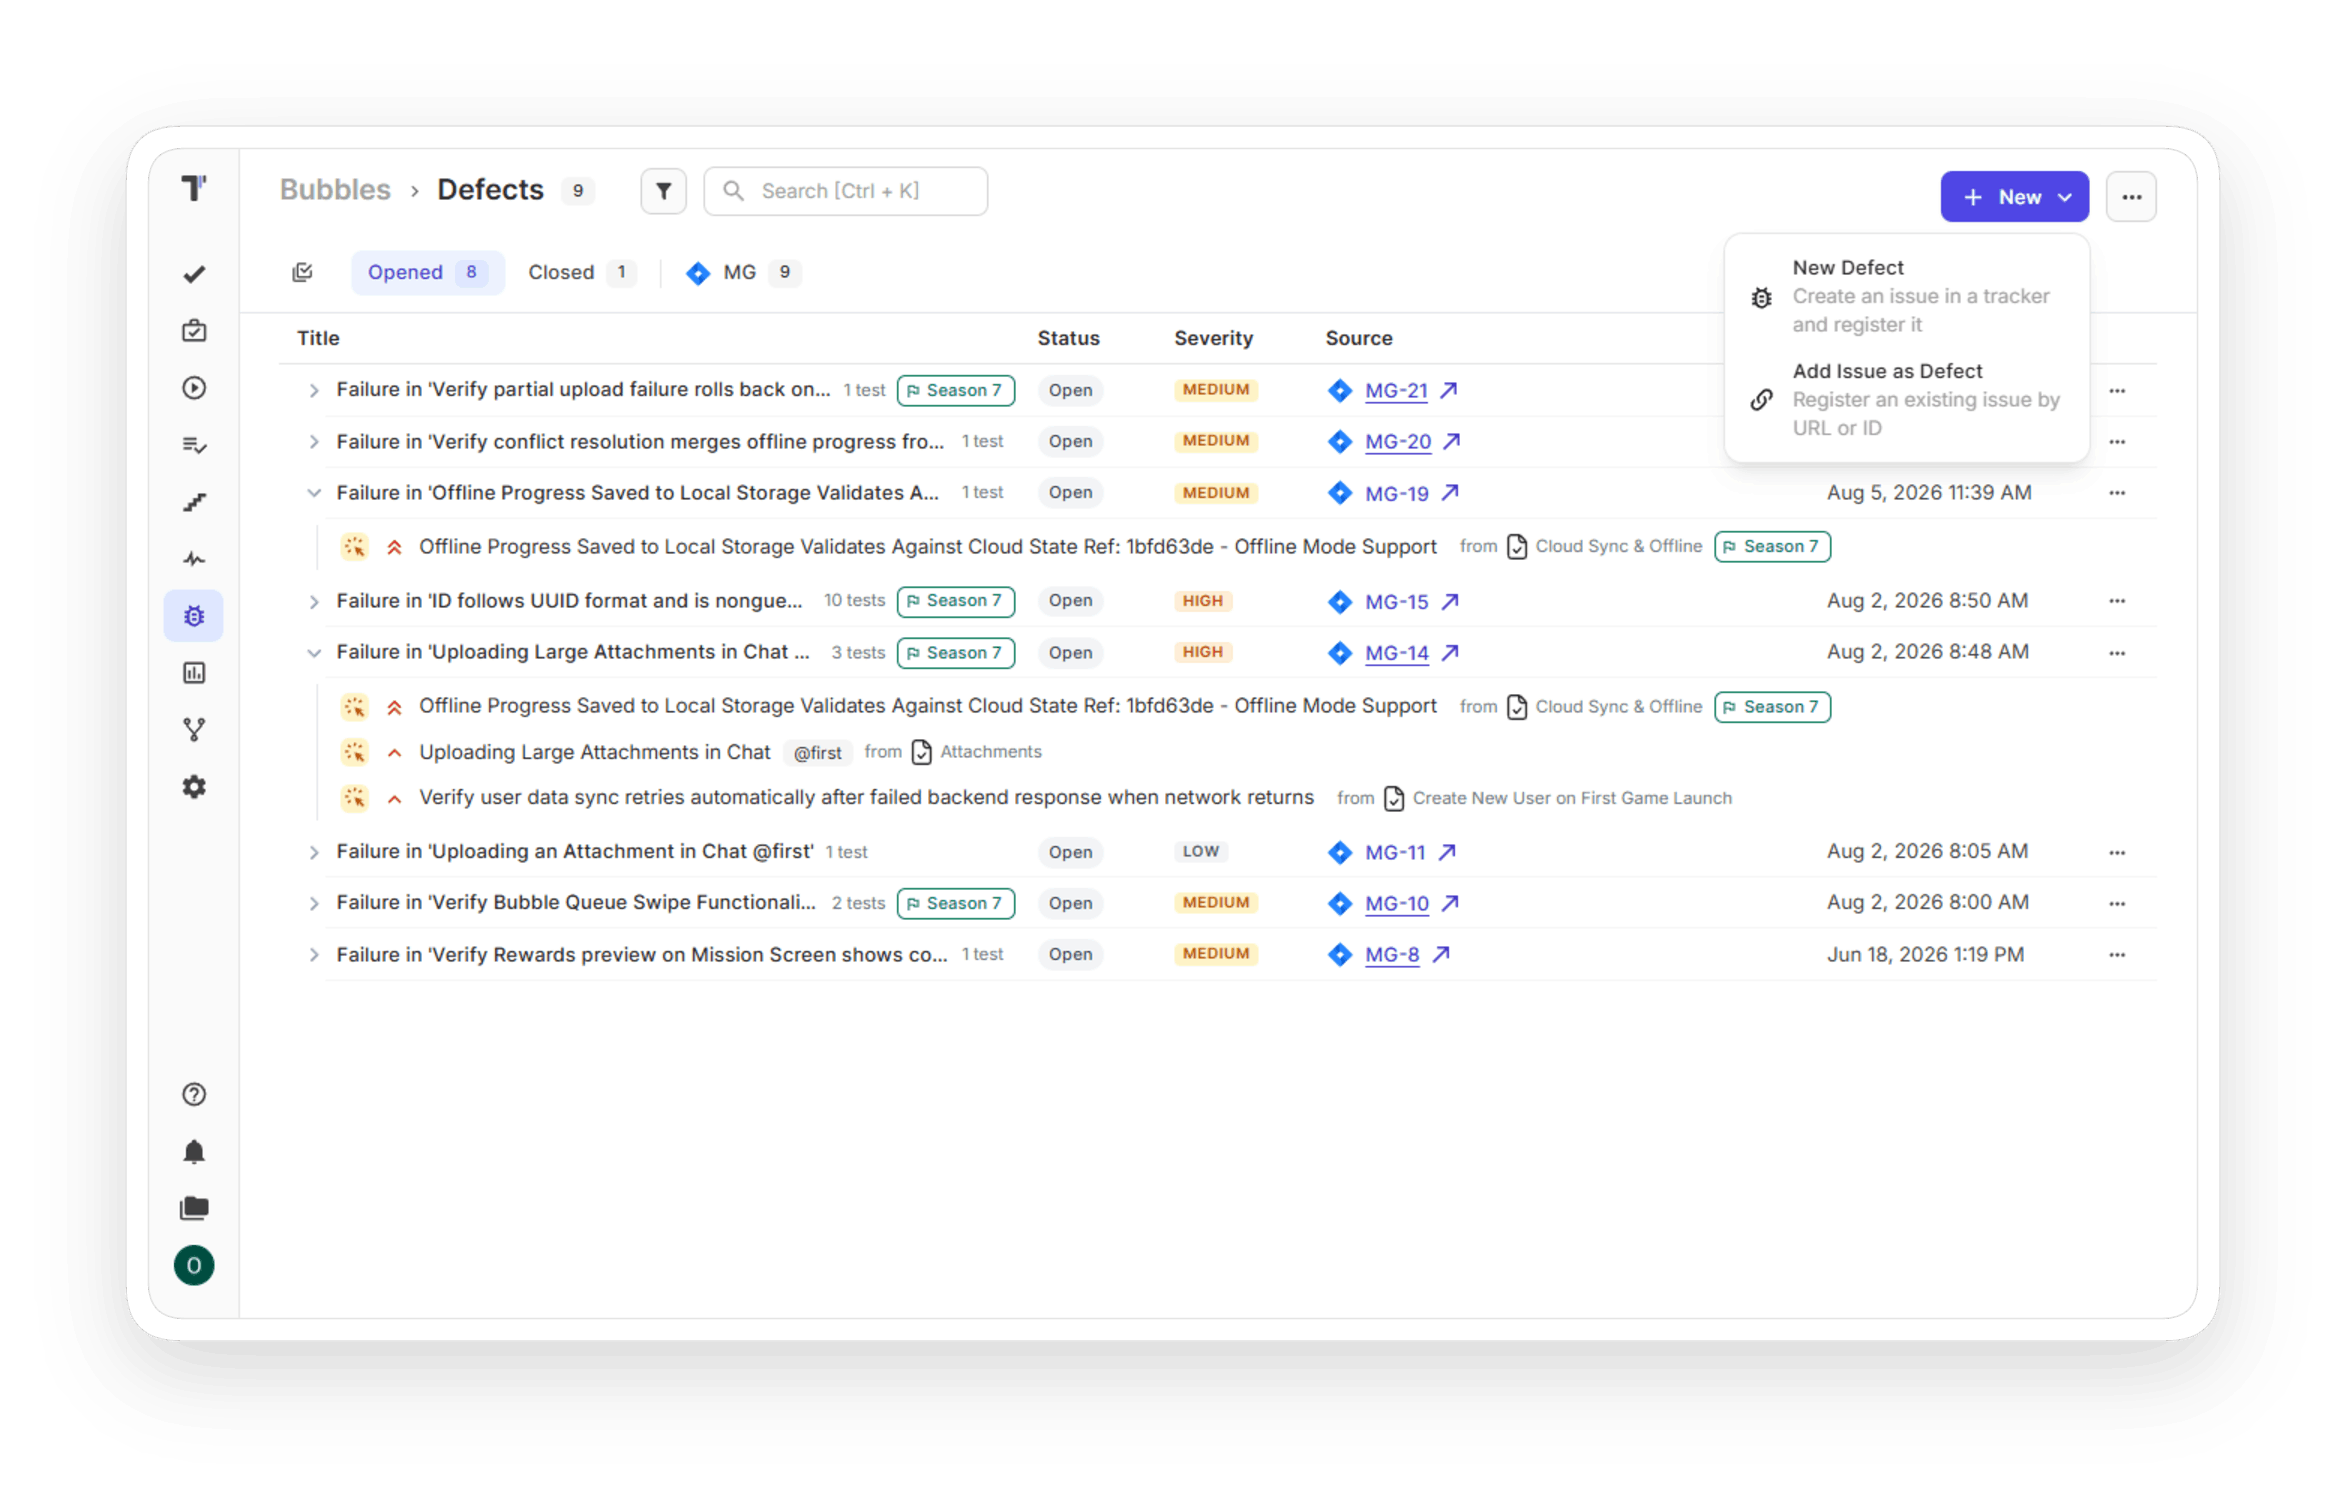
- Failed test analysis links new errors to historical failures, so you can see if an error happened before.
- Test analytics and automation metrics show you the slowest tests and the tests that never ran.
- The AI project runs status report gives you a summary of recent runs for a release discussion.
#3: Open Access For Your Models And Agents
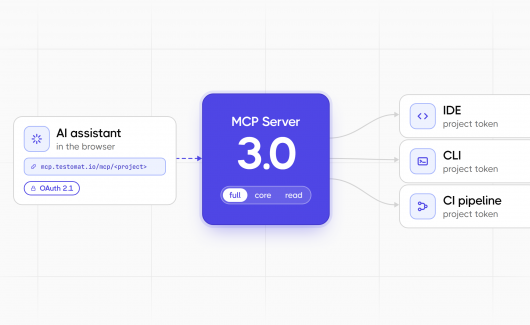
You may want to train a model or connect an AI agent to your test data. With the Testomat.io MCP server, your AI agents get access to test data through the Model Context Protocol. In our overview of MCP server testing tools, you can compare similar options. With the custom AI provider feature, you can choose the model for Testomat.io AI-powered features. You can keep the built-in default model or connect OpenAI, Anthropic, Amazon Bedrock or Microsoft Azure OpenAI. Then AI processes such as failure clusterization and the status report run on a provider that matches your security policy. Testomat.io designed this option for Enterprise teams with specific security requirements.
Bottom Line
Predictive analytics enables faster and safer releases, but it needs the history you collect today. If your model learns from a short history full of flaky failures, you get weak predictions. So your first task is simple: keep all your results in the same tool and mark flaky tests. After a few weeks of clean history, you can add predictive test selection in CI to optimize your test runs. Then you can compare the selected tests with real failures. Start a free trial at Testomat.io and review a month of run history in the analytics dashboard.